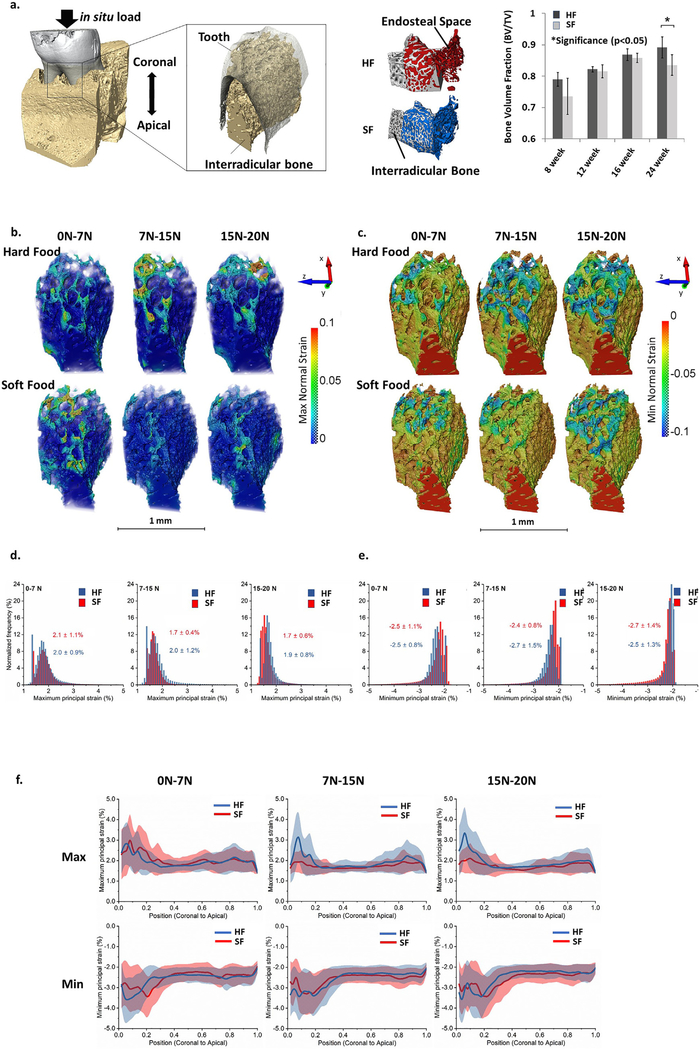
Fig. 3 –
Tensile and compressive strain maps and line profiles of mean strain values within interradicular bone specific to hard and soft food food hardness groups. (a) (left) 3D rendered volume of a DAJ along with a segmented volume and a surface of interradicular bone are shown. (center) Differences in porosity of interradicular alveolar bone in HF (red) and SF (blue) groups were observed. (right) Adaptations in bone architecture were measured in interradicular bone by calculating bone volume fraction (BVF) from three-dimensional volumes reconstructed using X-ray tomograms. BVF of interradicular bone increased with age and a significant difference between HF and SF groups at 24 weeks was observed. This figure is adapted with permission from Jang et al. ©2015 Elsevier. (b and c) Stepwise (7, 15, and 20 N) maximum (b) and minimum (c) normal strain maps in HF and SF groups to represent the incremental strain distribution within interradicular bone. (d-e) Normalized frequency of maximum (d) and minimum (e) normal strains at different loading stages: 0–7 N, 7–15 N, 15–20 N. Average ± standard deviation of maximum and minimum strain values (%) are indicated. (f) Line profiles of maximum and minimum normal strains from coronal to apical (in z direction) in HF and SF groups indicated maximum variation at the coronal regions irrespective of SF or HF groups. Maximum strain values were recorded in the most coronal region of the interradicular bone.

