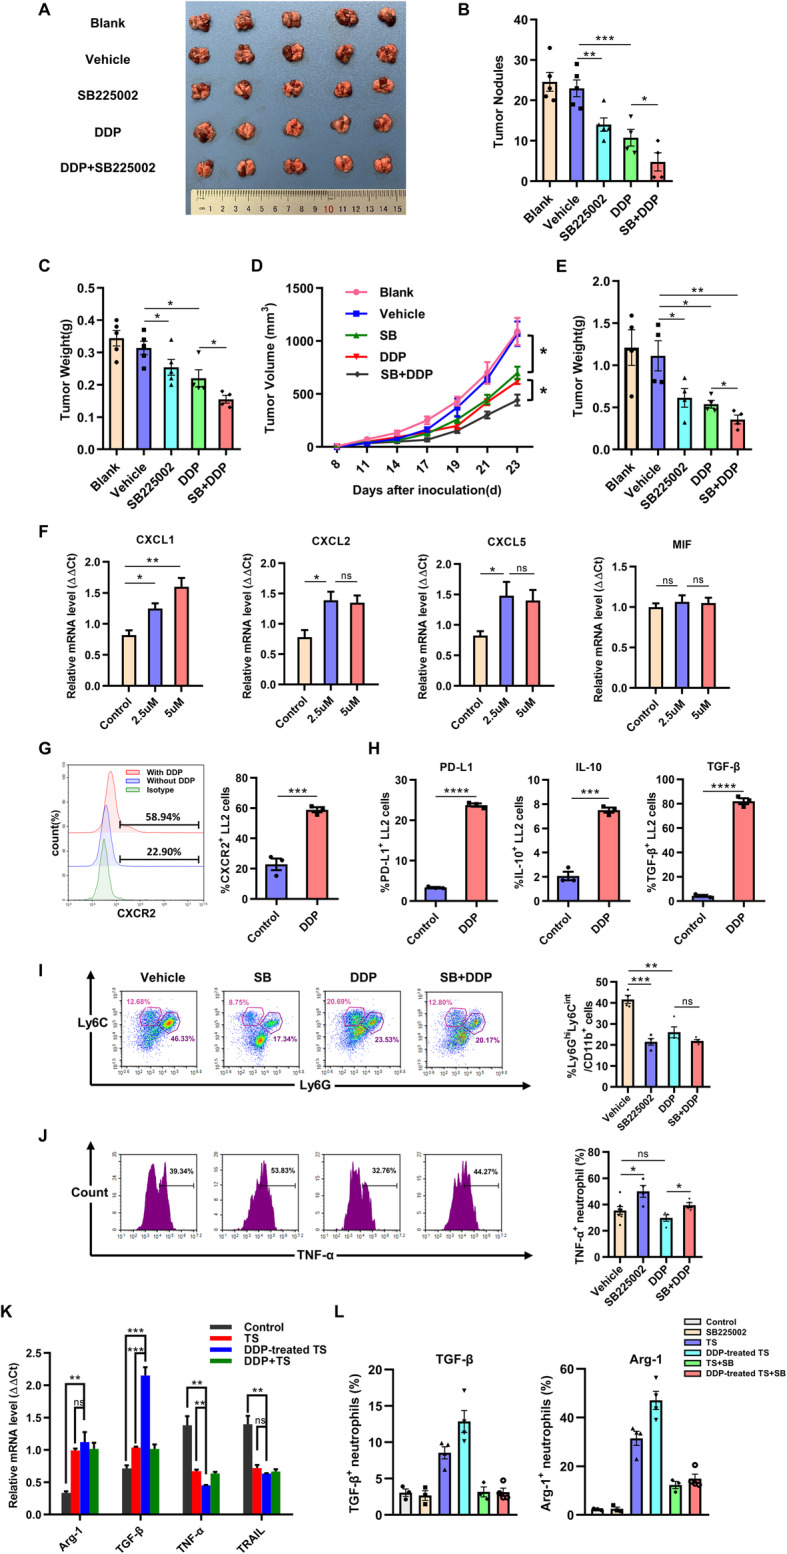
Fig. 8.

SB225002 and cisplatin shows combined treatment efficacy on lung cancer. LL2-bearing mice were randomly divided into 5 groups: blank control, solvent control group (vehicle, 25% PEG 400 + 5% Tween 80 + 69%ddH2O + 1%DMSO), SB225002 group (10 mg/kg once a day), cisplatin group (DDP, 2.5 mg/kg once a week), and SB225022 combined with DDP group. Each group contained 6–7 mice. a-c, For lung orthotopic tumor model, the representative picture of lung was shown (a), and the number of pulmonary nodules (b) and total lung weight (c) were counted. Data was shown as mean ± SD, n = 5. d-e, For subcutaneous tumor model, the tumor growth curves (d) and mean tumor weights at the end point of this experiment (e) were recorded. Data was shown as mean ± SD, n = 4–5. f, LL2 cells were treated by cisplatin (2.5 μM and 5 μM) for 24 h and collected. The relative mRNA expression of CXCL1, CXCL2, CXCL3 and MIF of LL2 cells following cisplatin treatment. Data was shown as mean ± SEM from three parallel experiments, n = 3. g, The expression of CXCR2 on LL2 cells surface following cisplatin treatment was detected by flow cytometry. Data was shown as mean ± SEM from three parallel experiments, n = 3. h, The levels of immunosuppressive molecules of LL2 cells following cisplatin treatment, including PD-L1, IL-10, and TGF-β, were measured by flow cytometry. Data was shown as mean ± SEM from three parallel experiments, n = 3. i, Flow cytometric analyses of neutrophils infiltrated into tumor microenvironment of mice from 5 experimental groups (left) and quantification of infiltrated neutrophils (right). Data was shown as mean ± SD, n = 4–5. j, The expression level of TNF-α secreted by neutrophils by flow cytometric analyses (left) and quantification of TNF-α level (right). Data was shown as mean ± SD, n = 4–5. k, The relative mRNA expressions of Arg-1, TGF-β, TNF-α and TRAIL of neutrophils after TS or DDP-treated TS treatment. Data was shown as mean ± SEM from three parallel experiments, n = 3. l, Based on the treatment of Fig. 8k, SB225002 of 500 nM was further administrated. The expressions of Arg-1, TGF-β of neutrophils were detected by flow cytometry. Data was shown as mean ± SEM from three parallel experiments, n = 3. SB, SB225002; TS, tumor supernatant. *p < 0.05, **p < 0.01, ***p < 0.001, ns represents p > 0.05
