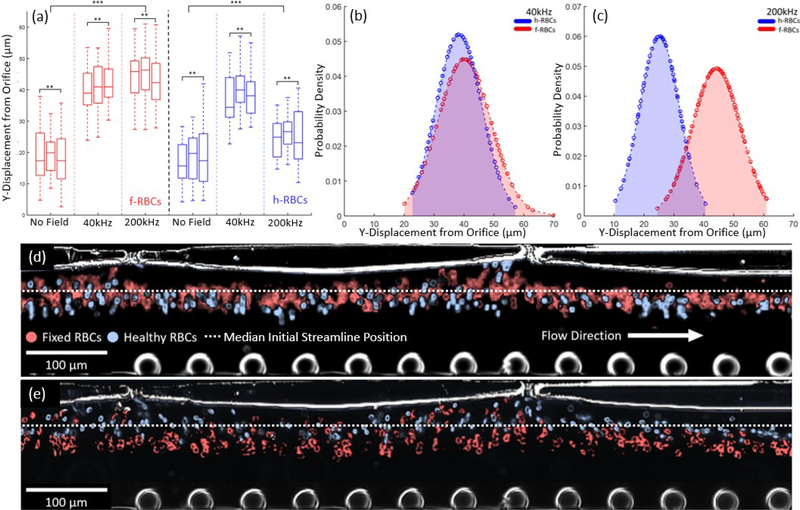
Figure 7.
(a) Box plot of lateral displacement of streamlines from orifice for samples of healthy RBCs (h-RBCs) and fixed RBCs (f-RBCs) (1% glutaraldehyde) under conditions of: no stimulation and 80Vpp stimulation at 40kHz and 200kHz, to indicate the spatial separation under the respective conditions. Normalized distance probability densities under: (b) 80Vpp at 40kHz stimulation wherein h-RBCs and f-RBCs show nDEP; and (c) 80Vpp at 200kHz wherein h-RBCs show pDEP and f-RBCs show nDEP. Color corrected stacked images of h-RBCs and f-RBCs under 80Vpp at: (d) 40kHz; and (e) 200 kHz (video in ESI).

