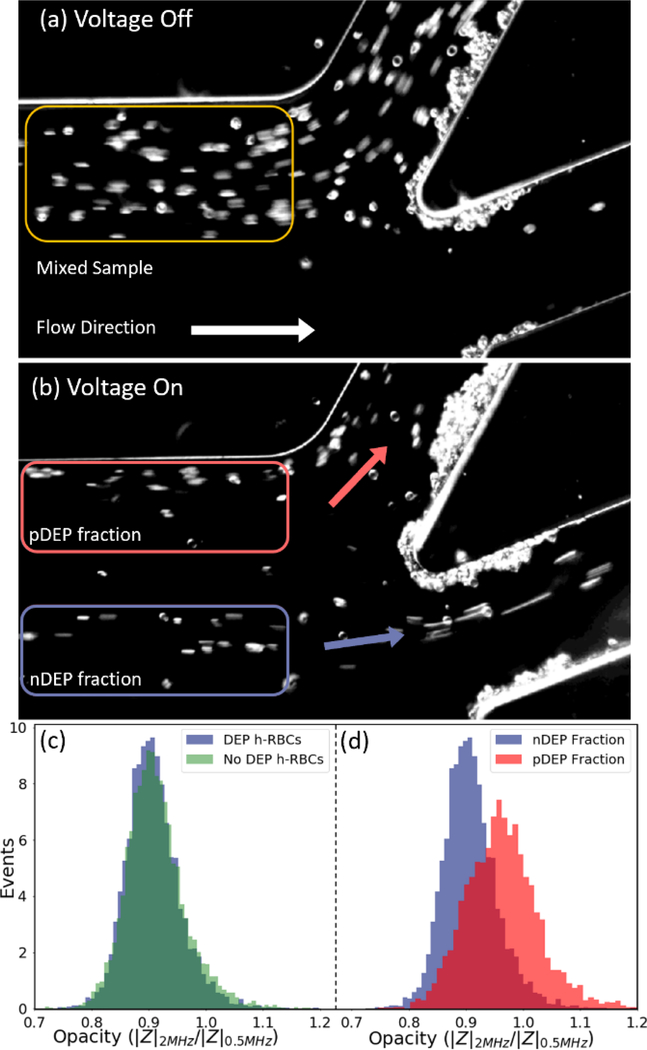
Figure 8.
Imaged cell streamlines at the collection channels before (a) and after (b) DEP separation, shows a low membrane capacitance fraction (presumably f-RBCs) exhibiting nDEP and a high membrane capacitance fraction (presumably h-RBCs) exhibiting pDEP under 100 Vpp at 300 kHz, at a sample flow rate of 3.6 μl/min. The separated fractions measured downstream by single-cell impedance cytometry (10,000 events for each cell type) show: (c) invariance of electrical opacity of collected h-RBCs before versus after DEP through the device; (d) distinctly higher electrical opacity (lower membrane capacitance) for the collected nDEP fraction versus the pDEP fractions. (video in ESI)

