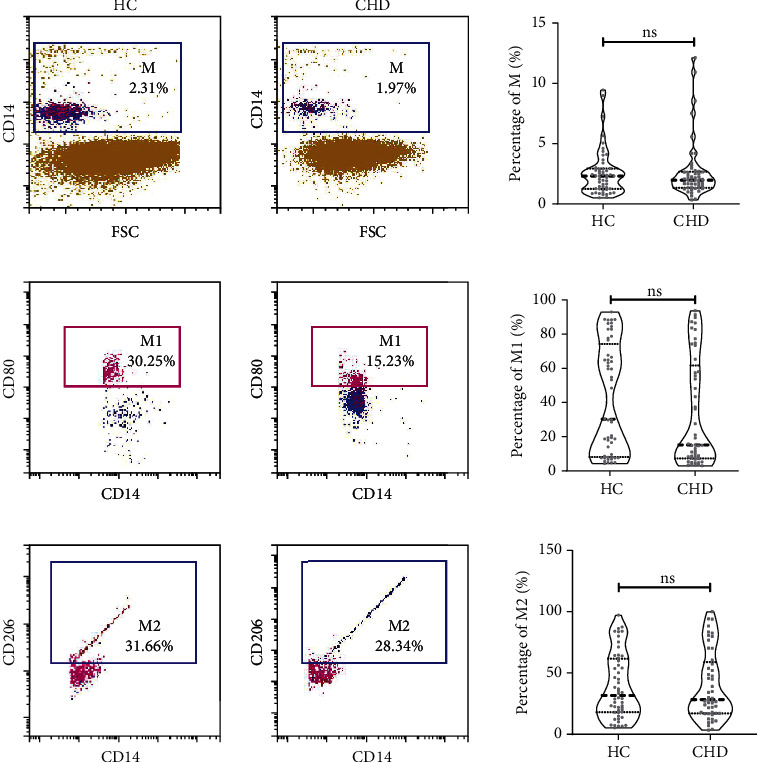
Figure 1.

Expression difference of total macrophage, M1, and M2 macrophage between CHD group and HC group. Data are represented as mean ± SEM. ∗P < 0.05, ∗∗P < 0.01. M: macrophage, labeled by CD14+ molecule; M1: M1 macrophage, labeled by CD14+ and CD80+ molecule; M2: M2 macrophage, labeled by CD14+ and CD206+ molecule.
