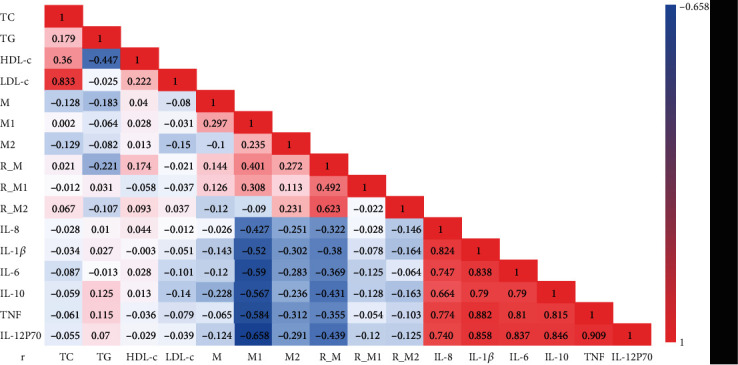
Figure 4.

Correlation analysis between lipid markers, macrophage, GLP-1R, and cytokines in total 101 people. Spearman rank correlation was used. Value is correlation coefficient, bold black font represents P < 0.05, bold red font means P < 0.01. Colors represent different correlation coefficient as indicated by the color bar. R_M: GLP-1R_M; R_M1: GLP-1R_M1; R_M2: GLP-1R_M2.
