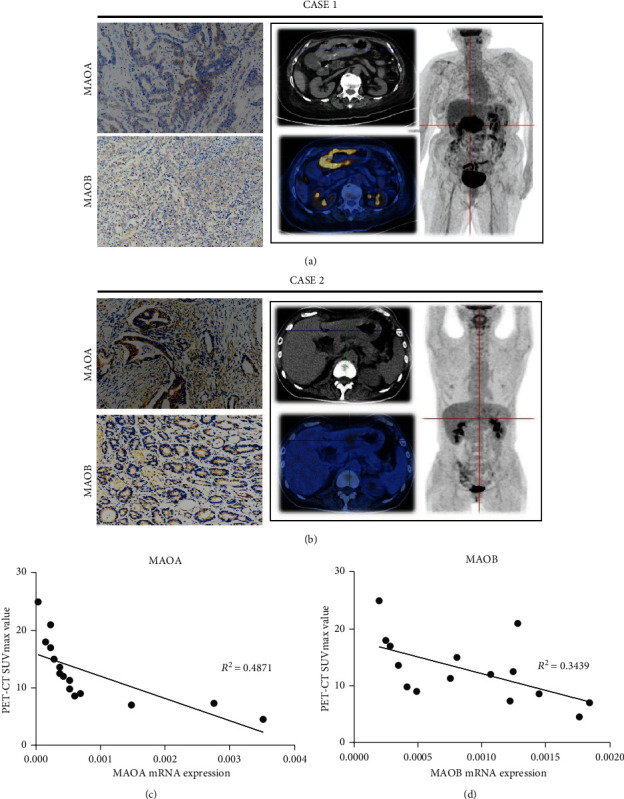
Figure 5.

The MAOA and MAOB expression levels are negatively correlated with glycolysis activity. One case showed low MAOA and MAOB expression with high glycolysis activity (a). Another case showed high MAOA and MAOB expression with low glycolysis activity (b). MAOA mRNA expression was negatively correlated with the SUVmax value of PET-CT (c). MAOB mRNA expression was negatively correlated with the SUVmax value of PET-CT (d).
