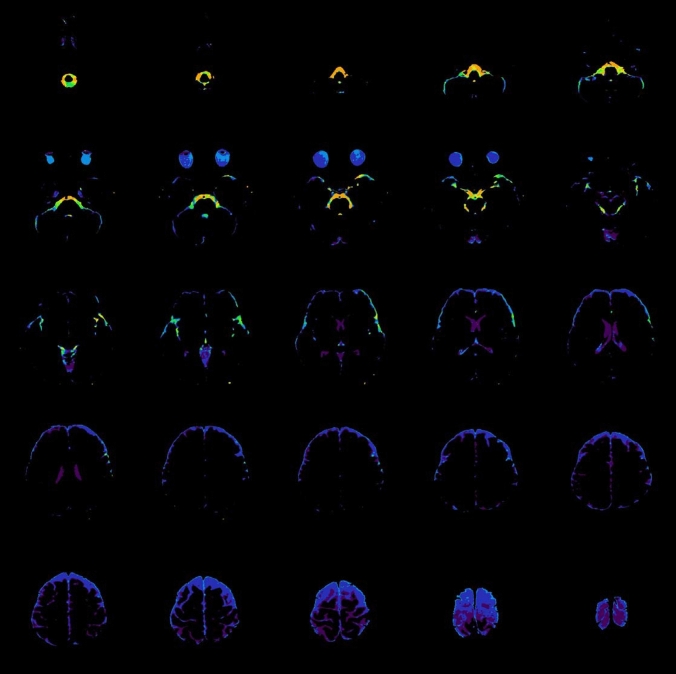
Fig. 2.
Diffusion analysis of fluid dynamics with incremental strength of motion proving gradient (DANDYISM): a binary map of the areas with motion-related signal dephasing with various b values; b whole-brain color-coded DANDYISM images. Binary map of the areas with motion-related signal dephasing with various b values, which are segmented by the auto-thresholding function of ImageJ software [7]. Images of various b values (b = 50, 100, 200, 300, 500, 700, 1000 s/mm2) at the level of the suprasellar cistern and Sylvian vallecula are shown (a). Color composite images in which areas with signal drop due to motion-related signal dephasing on various b value images are color-coded with colors as follows: orange: b = 50 s/mm2, yellow: b = 100 s/mm2, light green: b = 200 s/mm2, green: b = 300 s/mm2, blue: b = 500 s/mm2, indigo: b = 700 s/mm2, purple: b = 1000 s/mm2. Whole-brain images are shown (b). Note that signal drop occurs with lower b values in the area including the ventral portion of the posterior fossa, suprasellar cistern, and Sylvian fissure, indicating greater CSF motions. In contrast, signal drop in the lateral ventricle or subarachnoid space of the parietal region occurs only with higher b values, indicating smaller CSF motions


