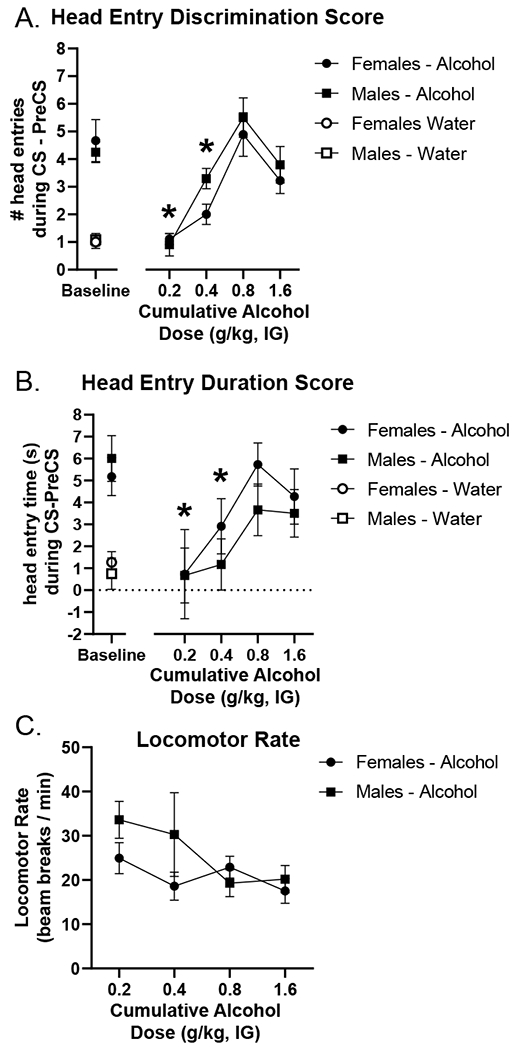
Figure 4.

Generalization curve to assess cue specificity as measured by the primary dependent variable (mean±SEM): head entry discrimination score (A) in addition to corresponding head entry duration in seconds (B). Pre-test baseline (average of the previous two water and alcohol sessions) is located on the left. Both head entry discrimination score and duration discrimination scores (mean±SEM) increased as the cumulative dose increased with the 0.8 g/kg dose in the curve not differing from pre-test baseline, showing full substitution for the training dose. Furthermore, head entry discrimination score and head entry duration were significantly lower following 0.2 and 0.4 g/kg doses in the curve compared to 0.8 g/kg in both males and females demonstrating selectivity for the training dose (3A). There were no sex differences on these generalization tests. Locomotor rate was significantly higher at the 0.2 g/kg dose in the curve compared to 0.8 g/kg (C). * p<0.05 different from 0.8 g/kg alcohol.
