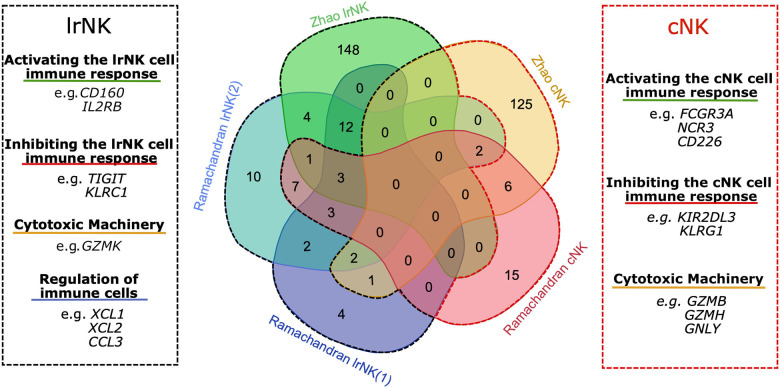
Figure 1.
Overlap of up-regulated genes in lrNK cell populations from human liver scRNA-seq datasets. Venn diagram illustrating the overlap of DEG within each NK cell cluster of both the Zhao et al. (36) and Ramachandran et al. (39) datasets. The black dashed line and the red dashed line indicate genes up-regulated in lrNK cell clusters and cNK clusters respectively.

