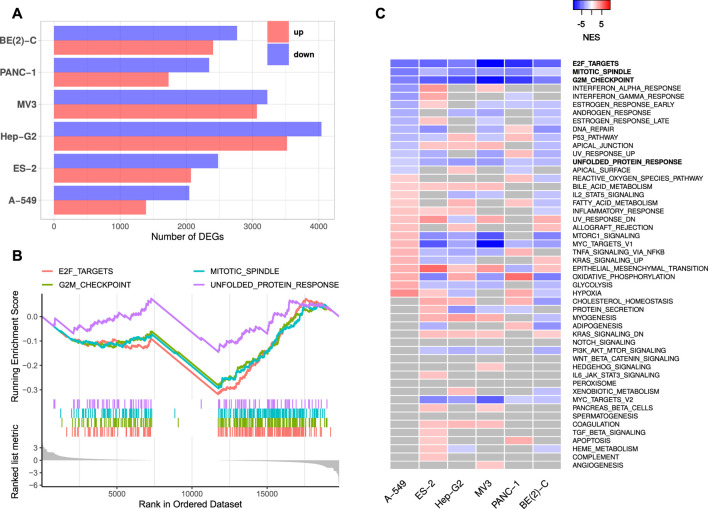
FIGURE 1.
IGF2BP1 knockdown RNA-seq experiments. (A) Numbers of significantly up- and downregulated protein-coding genes upon IGF2BP1 knockdown in six distinct cell lines. (B) Exemplary GSEA running sum plot of the consistently negatively enriched hallmark gene sets from A-549 cells. (C) Normalized enrichment scores (NES) obtained by GSEA using hallmark gene sets. Gray values represent non-significant results (FDR ≥0.05).

