Figure 2.
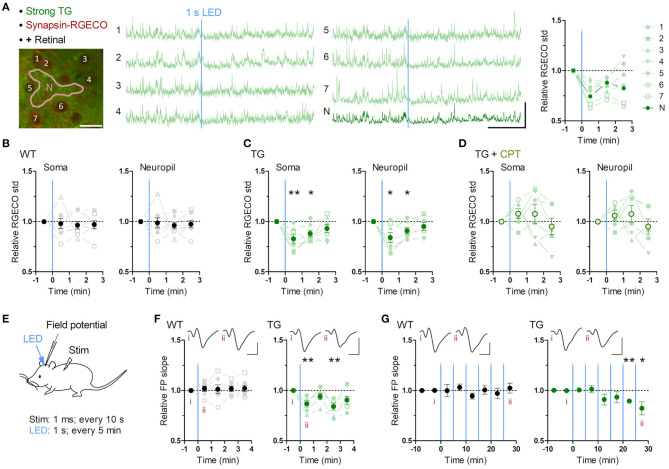
Brief astrocytic Gq activation suppresses neuronal activity. (A–D) Neuronal Ca2+ imaging from somatosensory cortex layer 2/3 in awake mice with optogenetic induction of Gq signaling in astrocytes. (A) Representative two-photon image of somatosensory cortex of a strong TG mouse expressing jRGECO1a (RGECO) in neurons by AAV-Syn-jRGECO1a (left). RGECO F/F0 from the labeled somata (1-6) and neuropil (N) decreased rapidly after 1 s LED illumination (middle). Ca2+ activity, measured as the standard deviation (std) of RGECO F/F0, decreased in the first and the second 1 min after LED illumination (right). Scale bars: 20 μm (micrograph); 100% F/F0 and 1 min (traces). (B) Ca2+ activity of neuronal somata and neuropil in WT mice did not change after LED illumination (p > 0.70 and p > 0.80, paired t-test, 1 min after LED illumination vs. 1 min before LED illumination, eight mice). (C) Ca2+ activity of neuronal somata and neuropil in TG mice decreased in the first and second minutes after LED illumination (first minute: p < 0.008 and p < 0.03; second minute: p < 0.02 and p < 0.03, paired t-test vs. 1 min before LED illumination, seven mice). (D) Adenosine A1R antagonist CPT blocked Optoα1AR-induced neuronal Ca2+ activity decrease in somata and neuropil (p > 0.18 and p > 0.25, paired t-test, 1 min after LED illumination vs. 1 min before LED illumination, six mice). (E–G) Sensory evoked field potential (FP) recording in somatosensory cortex layer 2/3 of shallowly anesthetized mice upon LED illumination. (E) FP response was evoked by sensory stimulation to the trunk (duration 1 ms, interval 10 s) before and after brief LED illumination (1 mW, duration 1 s). Six optical stimulations (5 min interval) were performed in a session. (F) LED time-triggered averaging of FP slope shows a reduction of sensory evoked response after astrocytic Gq activation in the first 1 min (p < 0.008, paired t-test vs. 1 min before LED illumination, six TG mice). WT mice did not show a significant change in FP slope (p > 0.51, paired t-test vs. 1 min before LED illumination, seven WT mice). This reduction in TG mice was detectable 3 min after LED illumination (p < 0.008, paired t-test vs. 1 min before LED illumination, six TG mice). Insets: averaged FP traces from a representative mouse, with the left and right traces averaged within 1 min before and 1 min after LED illumination, respectively. Scale-bars: 200 μV and 20 ms. (G) In the 30 min recording, evoked FP slope gradually decreased in TG mice (20–25 min and 25–30 min periods: p < 0.004 and <0.05, paired t-test vs. 0–10 min before LED illumination, six TG mice), while that in WT mice did not change throughout the 30 min period (p > 0.1, paired t-test vs. 0–10 min before LED illumination, seven WT mice). Insets: averaged FP traces from a representative mouse, with the left and right trace averaged within the 5 min period before the first LED illumination and the 5 min period after the last LED illumination, respectively. Scale bars: 200 μV and 20 ms. *p < 0.05, **p < 0.01.

