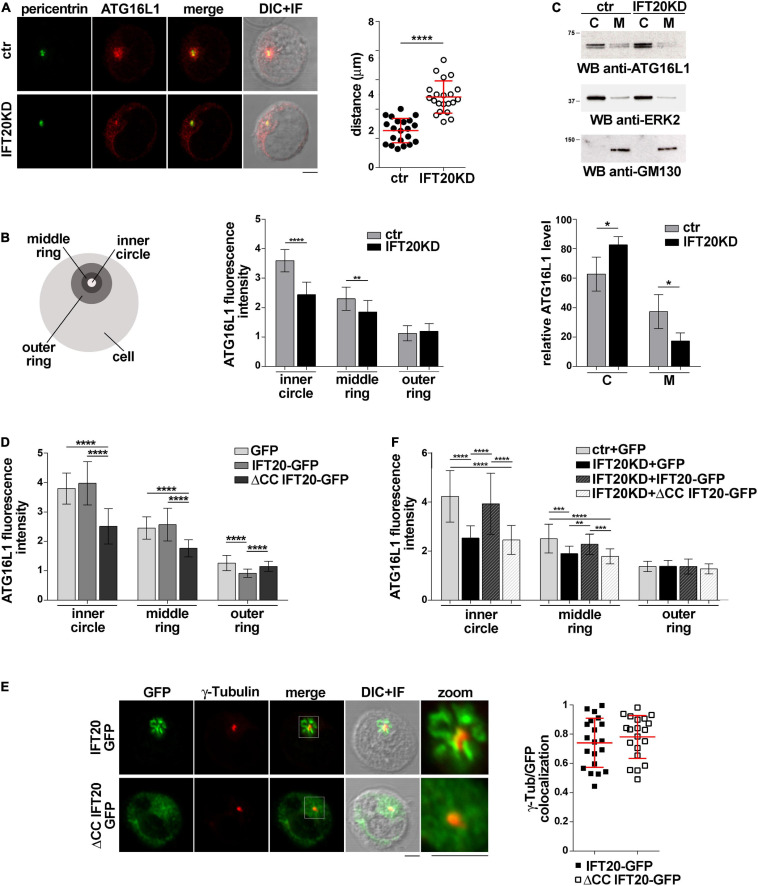
FIGURE 2.
IFT20 regulates the intracellular localization of ATG16L1. (A,B) Immunofluorescence analysis of ATG16L1 and the centrosomal protein pericentrin in control (ctr) and IFT20KD Jurkat cells. Representative medial optical sections and overlay of immunofluorescence and DIC images are shown (IF + DIC). Scale bars: 5 μm. (A) The graph shows the quantification of the distance of ATG16L1+ vesicles from the centrosome (mean ± SD, 21 cells; n = 3; Student’s t-test). (B) Histogram showing the quantification of fluorescence intensity in the concentric regions indicated in the scheme and defined from the point of ATG16L1 maximal intensity (mean ± SD, ≥ 20 cells/sample; n = 3; Mann–Whitney test). (C) Immunoblot analysis of ATG16L1 in cytosolic (C) and membrane (M) fractions purified from control and IFT20KD Jurkat cells. The cytosolic protein ERK2 and the cis-Golgi marker GM130 were used to assess the purity of cytosolic and membrane fractions, respectively. The migration of molecular mass markers is indicated. The histogram shows the quantification of the percentage of ATG16L1 in the cellular fractions obtained from 4 independent experiments (mean ± SD; Student’s t-test). (D) Immunofluorescence analysis of ATG16L1 in GFP, IFT20-GFP, and ΔCC IFT20-GFP Jurkat transfectants. The histograms show the quantification of fluorescence intensity in the concentric regions described above (mean ± SD, ≥ 25 cells/sample; n = 3; Mann–Whitney test). (E) Quantification (using Mander’s coefficient) of the weighted colocalization of γ-tubulin with GFP in medial confocal sections of IFT20-GFP or ΔCC IFT20-GFP expressing Jurkat cells (mean ± SD; ≥ 20 cells/line; n = 3). Representative images (medial optical sections and overlay DIC + IF) are shown. Scale bar: 5 μm. (F) Immunofluorescence analysis of ATG16L1 in control and IFT20KD cells transiently transfected with either empty vector (GFP), or the IFT20-GFP construct or the ΔCC IFT20-GFP construct. The graph shows the quantification of fluorescence intensity in the concentric regions described above (mean ± SD, ≥ 25 cells/sample; n = 3; Mann–Whitney test). *P < 0.05; **P < 0.01; ***P < 0.001; ****P < 0.0001.

