FIGURE 3.
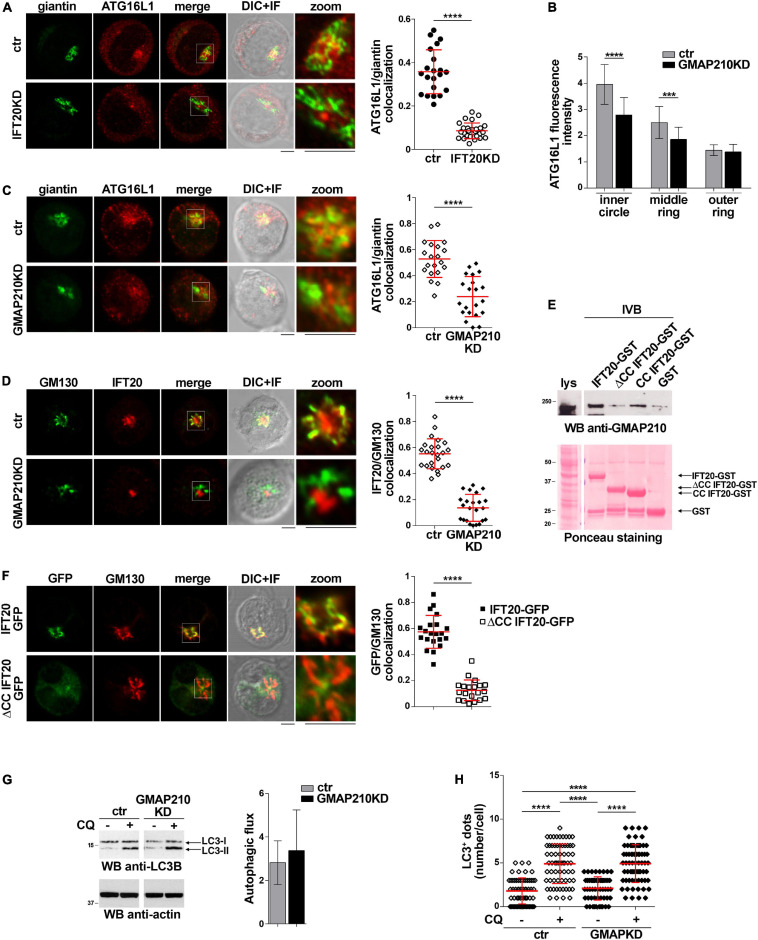
IFT20 couples ATG16L1 to the Golgi through its CC domain-mediated interaction with GMAP210. (A) Quantification using Mander’s coefficient of the weighted colocalization of ATG16L1 and the Golgi marker giantin in ctr and IFT20KD Jurkat cells (≥ 21 cells/sample, n = 3; mean ± SD; Student’s t-test). Representative images (medial optical sections and the overlay DIC + IF) are shown. Scale bar: 5 μm. (B) Quantification of fluorescence intensity of ATG16L1 in the concentric regions previously described (Figure 2B) in control and GMAP210KD cells (mean ± SD, ≥ 25 cells/sample; n = 3; Mann–Whitney test). (C,D) Immunofluorescence analysis of ATG16L1 and giantin (C) or IFT20 and the Golgi marker GM130 (D) in control and GMAP210KD cells. Representative medial optical sections and overlay of immunofluorescence (IF) and differential interference contrast (DIC) images are shown (IF + DIC). The graph shows the quantification (using Mander’s coefficient) of the weighted colocalization of ATG16L1 and giantin (C) or IFT20 and GM130 (D). The data are expressed as mean ± SD (≥ 20 cells/sample; n = 3; Mann–Whitney test). Scale bars: 5 μm. (E) Immunoblot analysis with anti-GMAP210 antibodies of in vitro-binding assays carried out on post-nuclear supernatants of Jurkat cells using IFT20-GST, ΔCC IFT20-GST and CC IFT20-GST fusion proteins, or GST as negative control. The Ponceau red staining of the same filter is shown to compare the levels of fusion proteins and GST used in the assay. The immunoblot shown is representative of three independent experiments. (F) Quantification (using Mander’s coefficient) of the weighted colocalization of the cis-Golgi marker GM130 with GFP in medial confocal sections of IFT20-GFP or ΔCC IFT20-GFP expressing Jurkat cells (mean ± SD; ≥ 20 cells/line; n = 3; Mann–Whitney test). Representative images (medial optical sections and overlay DIC + IF) are shown. Scale bar: 5 μm. (G) Immunoblot analysis of LC3B in lysates of control or GMAP210KD cells in the presence or absence of chloroquine (CQ, 40 μM). The migration of molecular mass markers is indicated. The histograms show the autophagic flux calculated as the difference in the levels of LC3II/actin between CQ-treated and CQ-untreated samples (mean fold ± SD; Student’s t-test; n ≥ 3). (H) Quantification of the number of LC3+ dots/cell in control or GMAP210KD cells either untreated or treated for 30 min with chloroquine (CQ, 40 μM). At least 35 cells from three independent experiments were analyzed (mean ± SD; Kruskal–Wallis test). **P < 0.01; ***P < 0.001; ****P < 0.0001.

