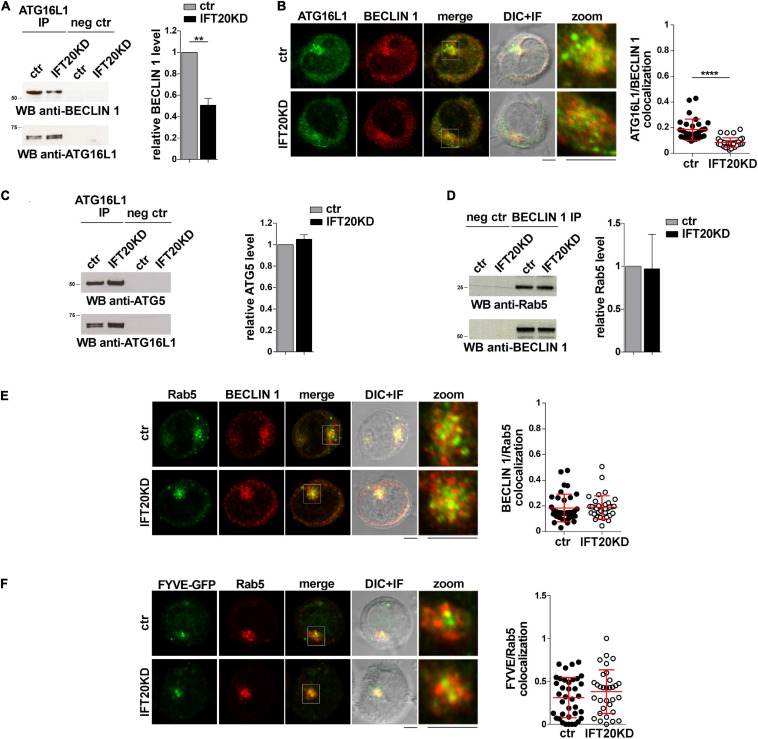
FIGURE 5.
IFT20 recruits ATG16L1 to early endosomes tagged for autophagosome formation. (A) Immunoblot analysis with BECLIN 1 antibodies of ATG16L1-specific immunoprecipitates from lysates of control and IFT20KD Jurkat cells. Preclearing controls are included in each blot (neg ctr). Tested proteins show comparable expression in total cell lysate from ctr and IFT20KD Jurkat cells (Supplementary Figures 3A,C). The migration of molecular mass markers is indicated. The quantification of the relative protein expression normalized to ATG16L1 (mean fold ± SD; ctr value = 1) is reported for each blot (n = 3; mean ± SD; Student’s t-test). (B) Quantification (using Mander’s coefficient) of the weighted colocalization of ATG16L1 with BECLIN 1 in medial confocal sections of control and IFT20KD Jurkat cells (mean ± SD; ≥ 30 cells/line; n = 3; Mann–Whitney test). Representative images (medial optical sections and overlay DIC + IF) are shown. Scale bar: 5 μm. (C) Immunoblot analysis with ATG5 antibodies of ATG16L1-specific immunoprecipitates from lysates of control and IFT20KD Jurkat cells. Preclearing controls are included in each blot (neg ctr). Tested proteins show comparable expression in total cell lysate from ctr and IFT20KD Jurkat cells (Supplementary Figures 3A,D). The migration of molecular mass markers is indicated. The quantification of the relative protein expression normalized to ATG16L1 (mean fold ± SD; ctr value = 1) is reported for each blot (n = 3; mean ± SD). (D) Immunoblot analysis with Rab5 antibodies of BECLIN 1-specific immunoprecipitates from lysates of control and IFT20KD Jurkat cells. Preclearing controls are included in each blot (neg ctr). Tested proteins show comparable expression in total cell lysate from ctr and IFT20KD Jurkat cells (Supplementary Figures 3B,C). The migration of molecular mass markers is indicated. The quantification of the relative protein expression normalized to ATG16L1 (mean fold ± SD; ctr value = 1) is reported for each blot (n = 3; mean ± SD). (E,F) Immunofluorescence analysis of BECLIN 1 and Rab5 (E) or FYVE-GFP and Rab5 (F) in control and IFT20KD Jurkat cells. Representative medial optical sections and overlay of immunofluorescence and DIC images are shown (IF + DIC). Scale bar: 5 μm. The graphs show the quantification of the weighted colocalization (Mander’s coefficient) of BECLIN 1 (E) or FYVE-GFP (F) and Rab5 in ctr and IFT20KD Jurkat cells (mean ± SD; ≥ 32 cells/line; n = 3; Mann–Whitney test). ****P < 0.0001.

