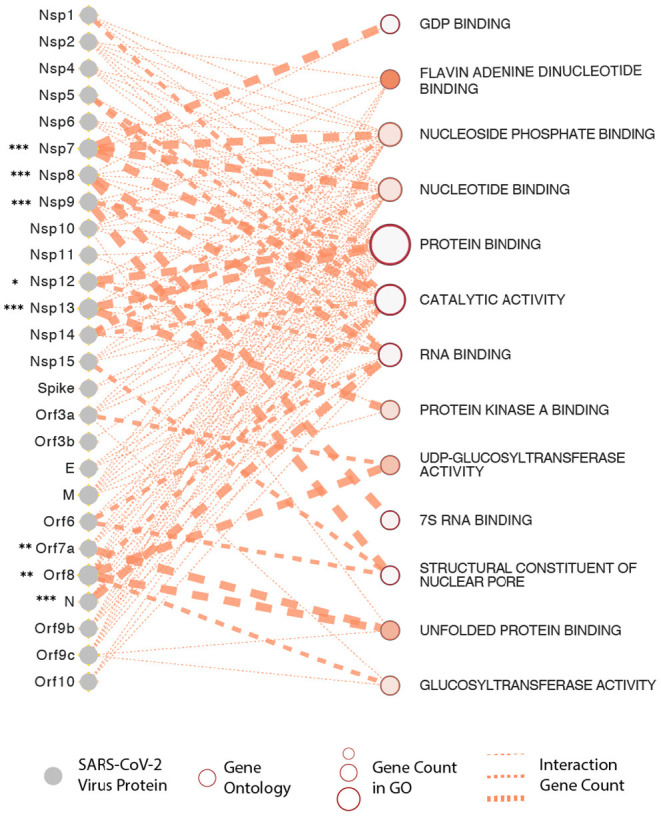
Figure 3.

SARS-CoV-2 proteins and gene ontologies of their interacting host genes. Size of gene ontology circle is proportional to the number of genes in the ontology, while thickness of the lines linking SARS-CoV-2 proteins and gene ontologies represents number of interacting genes in the ontology. SARS-CoV-2 proteins interacting with significantly higher number of host genes than expected are marked by asterisks, with representation: *P < 0.05, **P < 0.01, ***P < 0.001.
