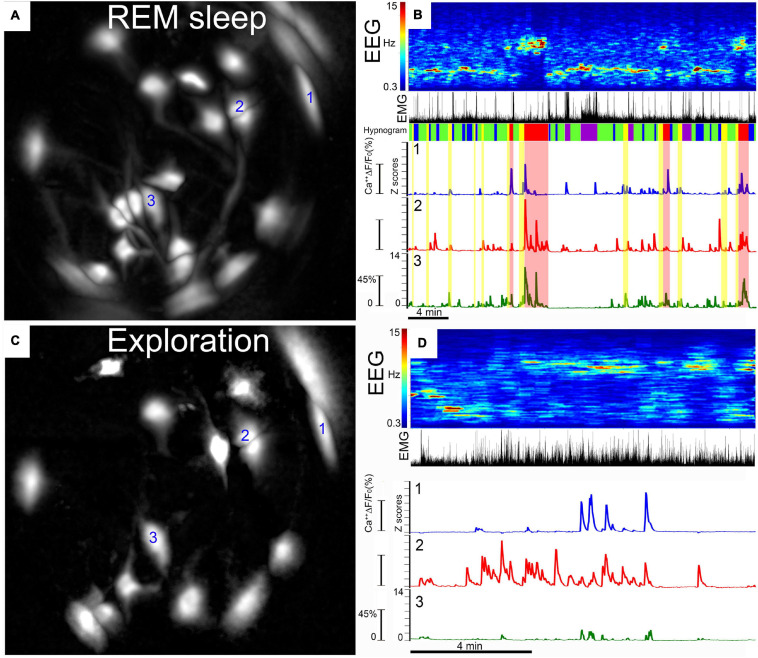
FIGURE 5.
Calcium fluorescence in individual MCH neurons. (A,C) Depict the same field of view of the GRIN lens with fluorescence (ΔF/F0) in somata and processes extracted automatically by PCA-ICA analysis. We have labeled the three neurons (labeled 1, 2, and 3) whose Ca2+ fluorescence is plotted in (B,D). (A) Depicts GCaMP6s fluorescence (ΔF/F0) in MCH neurons during REM sleep. Ca2+ imaging was performed simultaneously with recording of cortical EEG and EMG activity in the nuchal muscles. Behavioral video recordings were obtained and examined to identify behaviors such as walking, eating, grooming, or eating. Activity in the EEG (depicted as power spectra, 0.3–15 Hz) and the EMG is used to identify wake, NREM, and REM sleep states (labeled as hypnogram). The traces depict the change in fluorescence (ΔF/F) during wake–sleep bouts of the three neurons identified in (A). In each neuron, the ΔF/F0 (expressed as a z-score) varies with the wake–sleep state of the animal, with peak fluorescence associated with REM sleep. The hypnogram categorizes the sleep–wake states in the following colors: purple, active wake; blue, quiet wake; green, NREM; yellow, pre-REM sleep; red, REM sleep. (C) is the same field of view as in (A), but this image shows the PCA-ICA extracted neurons (ΔF/F0) while the mouse was engaged in exploring novel objects placed in its home cage. This image shows that some neurons that were evident in REM sleep (A) were also activated during exploratory behavior. However, some neurons in (A) were not evident during exploratory behavior, indicating selective activation of these neurons during REM sleep (A). Thirty percent of the neurons were activated during REM sleep but not during exploratory behavior, indicating that a subset of MCH neurons is selectively active in REM sleep. (D) GCaMP6s fluorescence in MCH neurons while exploring novel objects. The traces are from the same neurons represented in REM sleep (A). (For further details, please see Blanco-Centurion et al., 2019).

