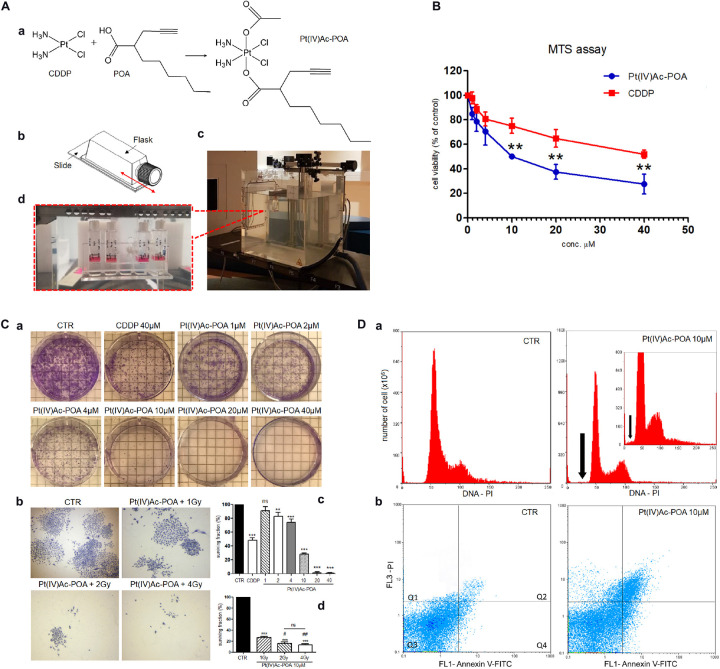
FIGURE 1.
(A) Schematic representation of (OC-6-44)-acetatodiamminedichlorido (2-(2-propynyl)octanoato)platinum(IV) [Pt(IV)Ac-POA] synthesis process and carbon ion irradiation. (a) Cisplatin (cis-dichlorodiammineplatinum, CDDP), 2-(2-propynyl)octanoic acid (POA), and the related Pt(IV) mixed derivative (Pt(IV)Ac-POA). (b) Flask sterile on slide used for U251 cell culture irradiation. (c) Equipment setup in the irradiation room facility at the CNAO Foundation. (d) Flasks positioned in a water phantom placed at a depth of 15 cm, corresponding to the central position of a 6-cm-wide spread-out Bragg peak (SOBP), even before irradiation with a horizontal beam. (B) Effects of Pt(IV)Ac-POA and CDDP on cell viability and proliferation of human U251 MB cell lineage. Cell viability/proliferation obtained using MTS assay after standard acute exposure, i.e., 48-h continuous treatment (CT), to increasing concentrations (1–40 μM) of either Pt(IV)Ac-POA or CDDP. The relative cell viability is expressed as a percentage relative to the untreated control cells. Data represent the mean ± SD. Statistical analysis by Student’s t-test: different from CDDP (∗∗p < 0.01). (C) Clonogenic cell survival assay showing the dose–response effect after 48-h CT to increasing concentrations of Pt(IV)Ac-POA alone (a,c) and combined with increasing carbon ion radiation doses (1–4 Gy) (b,d). (c,d) Histograms showing the U251 surviving fraction (in percent). Statistical analysis by one-way ANOVA followed by Dunnett’s test (histograms in (c) or post hoc Bonferroni’s test (histograms in d). Statistical significance calculated as follows: ∗control vs. each experimental condition; # Pt(IV)Ac-POA + 1 Gy vs. Pt(IV)Ac-POA CDDP + 2 or 4 Gy; ns, not significant. ∗p < 0.05; ∗∗p < 0.01; ∗∗∗p < 0.001; #p < 0.05; ##p < 0.01; ns: not significant. (D) Flow cytometry data after annexin V and propidium iodide (PI) staining. (a) Cytograms showing the DNA content after PI staining in U251 MB cell lineage: controls vs. treated cells [10 μM Pt(IV)Ac-POA 48-h CT]. Insert shows the cytogram of the 10 μM Pt(IV)Ac-POA-treated sample compared to a control sample with an identical number of analyzed cells (y = 800 × 106). The black arrow indicates the sub-G1 peak corresponding to dead cells. (b) Dual-parameter cytograms of FITC-labeled annexin V (FL1) vs. PI staining (FL3) in controls (CTR) and cells exposed to 10 μM Pt(IV)Ac-POA 48-h CT. Quadrants Q1, Q2, Q3, and Q4 show necrotic, late apoptotic, viable, and early apoptotic cells, respectively.

