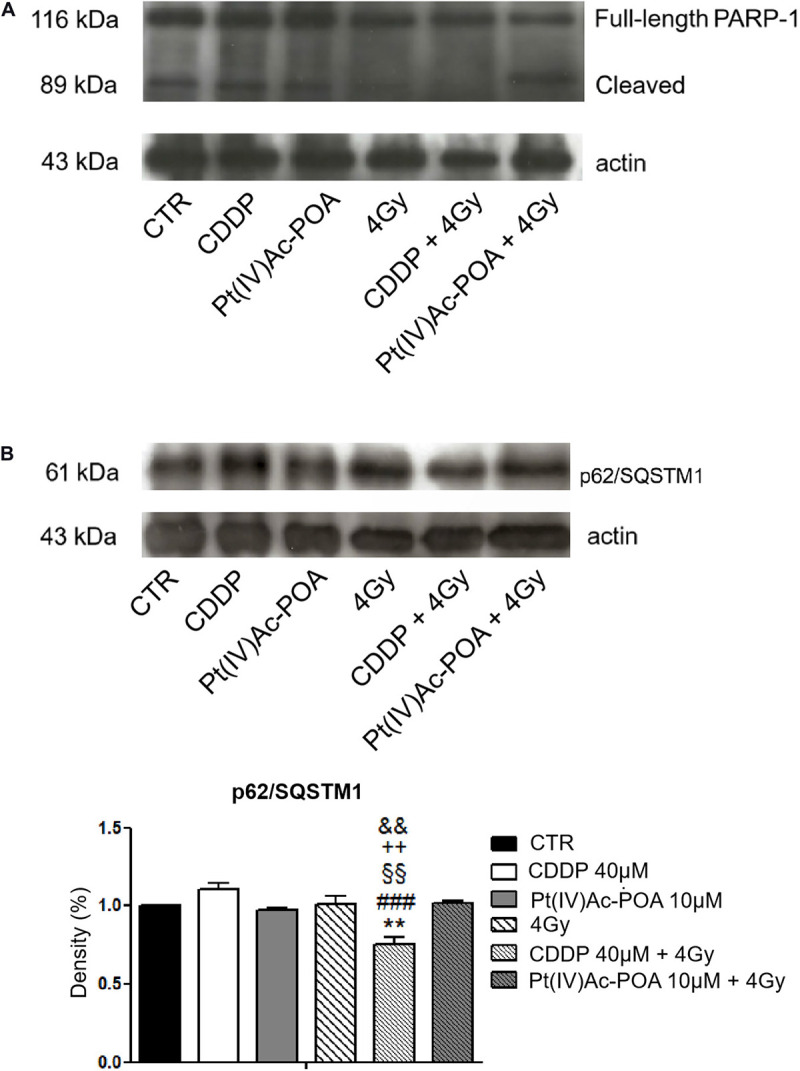
FIGURE 13.

(A) Western blotting analysis of full-length poly[ADP-ribose] polymerase 1 (PARP-1, 116 kDa) and cleaved PARP-1 (89 kDa). Representative Western blotting bands showing the expression levels of full-length PARP-1 (116 kDa) and cleaved PARP-1 in the controls, differently treated U251 cells, i.e., after 48-h continuous treatment (CT) with 40 μM cis-dichlorodiammineplatinum (CDDP) or 10 μM (OC-6-44)-acetatodiamminedichlorido(2-(2-propynyl)octanoato)platinum(IV) [Pt(IV)Ac-POA], after carbon ion irradiation (4 Gy dose) alone, and in combined exposure conditions [40 μM CDDP or 10 μM Pt(IV)Ac-POA 48-h CT + 4 Gy carbon ion irradiation]. The result was quantified from the average of three different samples. The density bands of full-length (116 kDa) and cleaved (89 kDa) PARP-1 were compared to the loading control and actin (43 kDa). (B) Western blotting study of p62/SQSTM1 as a typical marker of autophagy activation. Histograms representing density band quantification of p62/SQSTM1 (61 kDa) in the controls, differently treated U251 cells, i.e., after 48-h CT with 40 μM CDDP or 10 μM Pt(IV)Ac-POA, after carbon ion radiation (4 Gy dose) alone, and in combined exposure conditions [40 μM CDDP or 10 μM Pt(IV)Ac-POA 48-h CT + 4 Gy carbon ion radiation]. The means, obtained from three independent experiments, have been quantified and compared to the loading control and actin (43 kDa). Statistical significance calculated as follows: *control vs. CDDP + 4 Gy carbon ion radiation; #CDDP vs. CDDP + 4 Gy carbon ion radiation; § Pt(IV)Ac-POA vs. CDDP + 4 Gy carbon ion radiation; +4 Gy carbon ion radiation alone vs. CDDP + 4 Gy carbon ion radiation; &CDDP + 4 Gy carbon ion radiation vs. Pt(IV)Ac-POA + 4 Gy carbon ion radiation. **p < 0.01; ###p < 0.001; §§p < 0.01; + + p < 0.01; &&p < 0.01.
