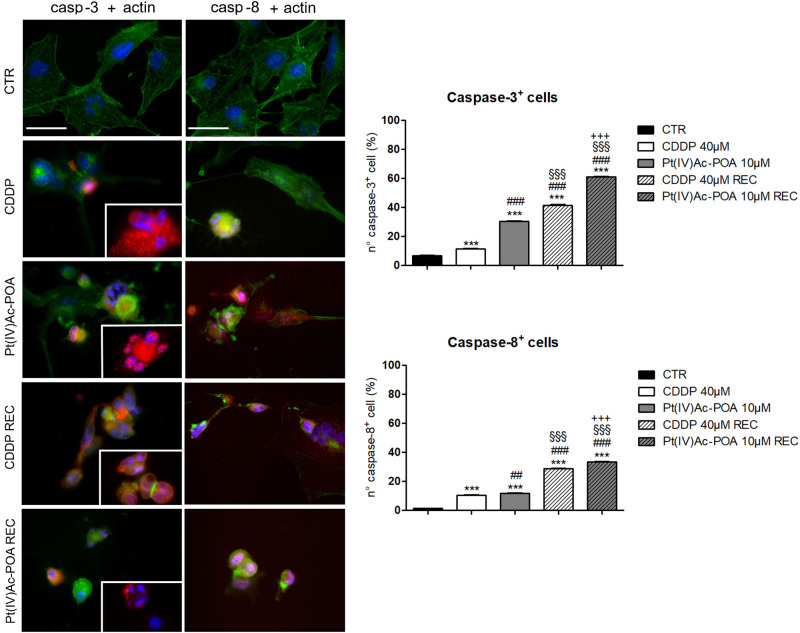
FIGURE 3.
Left panel: Apoptotic pathway investigated by fluorescence microscopy in the controls, differently treated U251 cells, i.e., after 48-h continuous treatment (CT) with 40 μM cis-dichlorodiammineplatinum (CDDP) or 10 μM (OC-6-44)-acetatodiamminedichlorido(2-(2-propynyl)octanoato)platinum(IV) [Pt(IV)Ac-POA], and in the recovered (REC) conditions. Double immunolabeling for active caspase-3 and caspase-8 (red fluorescence) and actin (green fluorescence). Nuclear counterstaining with Hoechst 33258 (blue fluorescence). Inserts: high-magnification micrographs showing caspase-immunopositive nuclei and collapsed cytoskeleton. Scale bar, 40 μm. Right panel: Histograms showing the percentage value of caspase-3- and caspase-8-immunopositive cells, respectively. Statistical significance calculated as follows: ∗control vs. each experimental condition; #CDDP vs. other treatments; §Pt(IV)Ac-POA vs. REC conditions; +CDDP REC conditions vs. Pt(IV)AC-POA REC. ∗∗∗p < 0.001. ###p < 0.01; ##p < 0.001; §§§p < 0.001; + + + p < 0.001.

