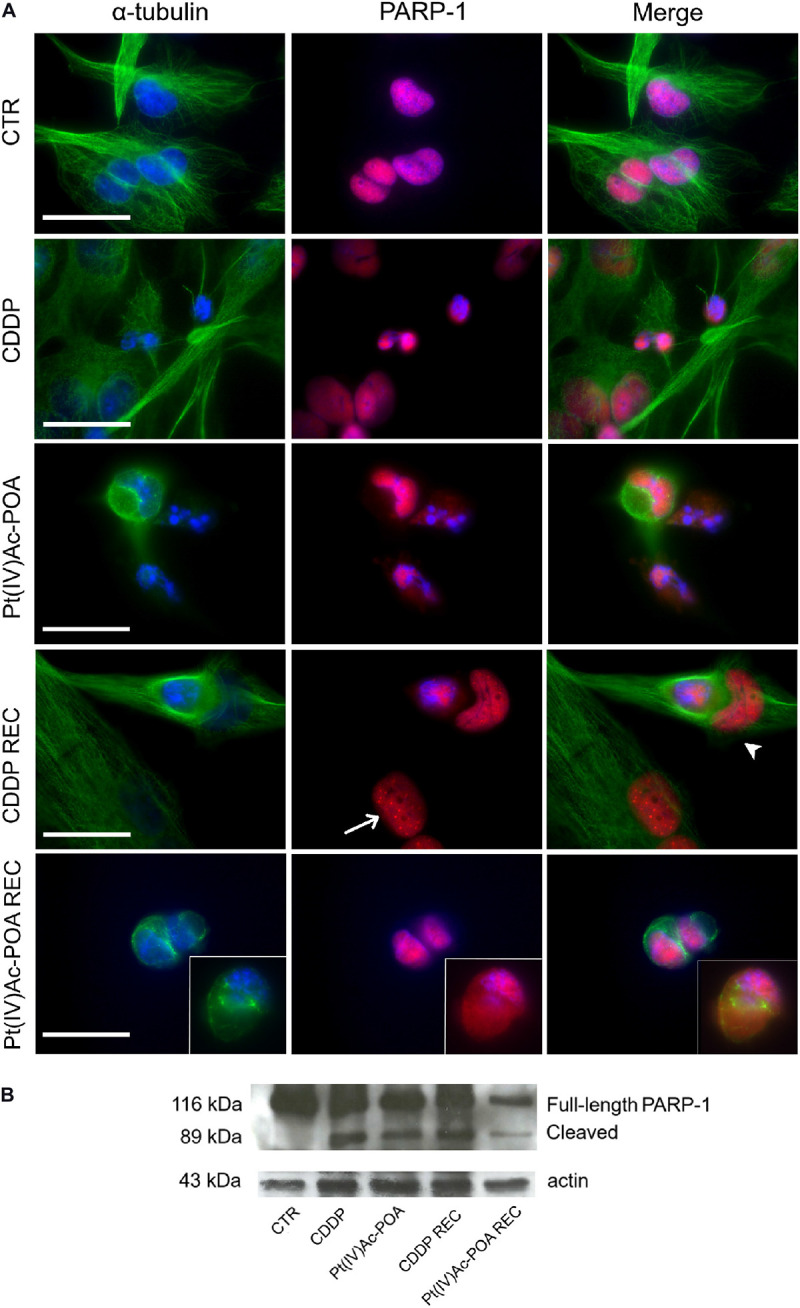
FIGURE 4.

Apoptotic pathway investigated using fluorescence microscopy. (A) Double immunofluorescence detection of poly[ADP-ribose] polymerase 1 (PARP-1, red fluorescence) and α-tubulin (green fluorescence) in the controls, differently treated U251 cells, i.e., after 48-h continuous treatment (CT) with 40 μM cis-dichlorodiammineplatinum (CDDP) or 10 μM (OC-6-44)-acetatodiamminedichlorido(2-(2-propynyl)octanoato)platinum(IV) [Pt(IV)Ac-POA], and in the recovered (REC) conditions. DNA counterstaining with Hoechst 33258 (blue fluorescence). Inserts: high-magnification micrographs showing PARP-1 translocation from the nucleus to the cytoplasm. Thin arrow indicates PARP-1 “spot-like” labeling, while arrowhead designates phagocytic cell. Cytoskeletal alterations are also noticeable. Scale bar, 20 μm. (B) Western blotting data showing full-length PARP-1 (116 kDa) and cleaved PARP-1 (89 kDa) bands, respectively, compared to the loading control and actin (43 kDa).
