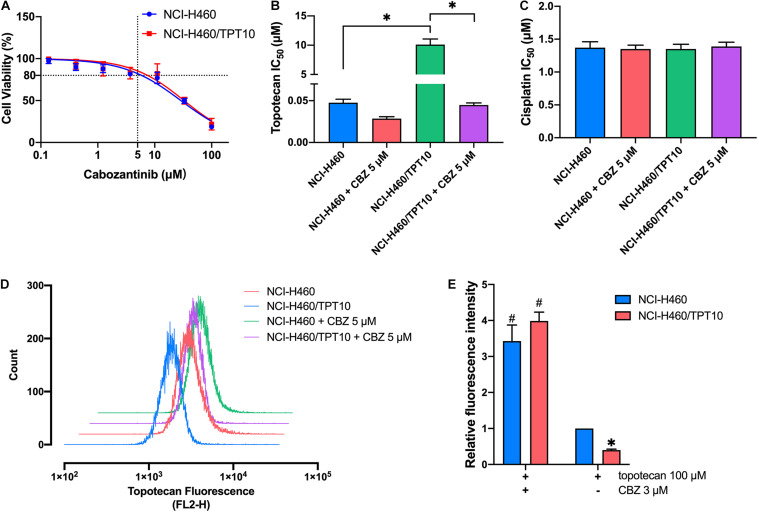
FIGURE 1.
Effect of cabozantinib on reversing topotecan resistance and restoring intracellular topotecan. (A) Cell viability was determined by MTT assay and displayed the changes in response to different concentrations of cabozantinib in topotecan-resistant NCI-H460/TPT10 and the parental NCI-H460 cells. Data points with error bars represented the mean viability (%) ±SD of at least three independent experiments, each done in triplicate. (B,C) Effects of cabozantinib on the IC50 values of topotecan (B) and cisplatin (C) in NCI-H460/TPT10 and NCI-H460 cells. CBZ is the abbreviation of cabozantinib. Columns and error bars represented mean ± SD of IC50 values acquired from three independent experiments in triplicate. ∗p < 0.05. (D) Flow cytometry detection of intracellular accumulation of topotecan in cells after 2 h exposure to 100 μM topotecan with or without 2 h pretreatment with 5 μM cabozantinib. (E) Intracellular topotecan accumulations in cells are represented by the fold of fluorescence intensity, which is calculated by (mean FL2-H unit of cells in 100 μM topotecan with or without cabozantinib – mean FL2-H unit of untreated cells with or without cabozantinib)/(mean FL2-H unit of parental cells in 100 μM topotecan – mean FL2-H unit of untreated parental cells). Fluorescence intensity of the accumulated topotecan in NCI-H460 cells without cabozantinib was normalized to 1. Columns and error bars represented average values with SD from three independent measurements. ∗indicates p < 0.05 comparing resistant cell line to parental cell line with the same treatment; #indicates p < 0.05 comparing a group with cabozantinib to the corresponding cell line group without cabozantinib.

