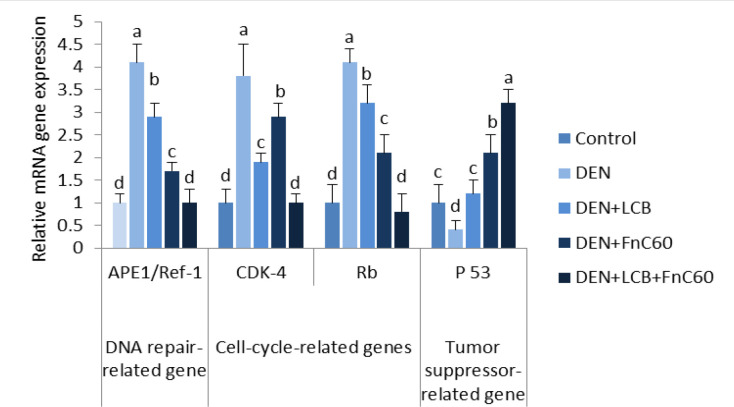
Figure 6.
Effect of LCB, FnC60, and DEN on the mRNA level APE-1/Ref-1, P53, Cdk-4, and Rb. The mRNA levels were quantified with GAPDH as an internal control. All values are expressed as mean ± SD. Values with different letters significantly differed from the control group (P < 0.05)
*Number of rats in each group = 10.

