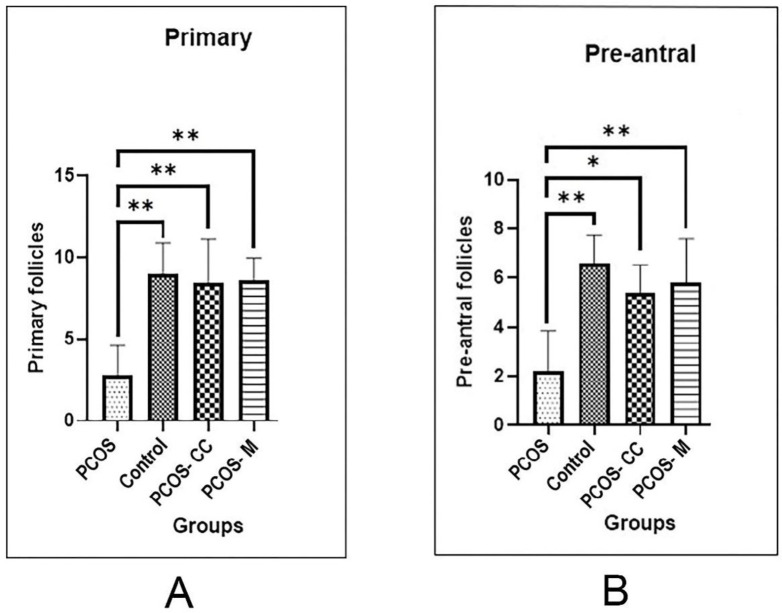
Figure 2.
Comparison the mean of follicle count between control, PCOS, and treatment groups (A) Primary follicle, (B) Pre-antral follicles. PCOS: polycystic ovary syndrome, control: healthy control, PCOS-CC: polycystic ovary syndrome treated with CC, PCOS-M: polycystic ovary syndrome treated with metformin. (Mean ± SD; ns: P > 0.05, *: P ≤ 0.05, **: P ≤ 0.01, ***: P ≤ 0.001

