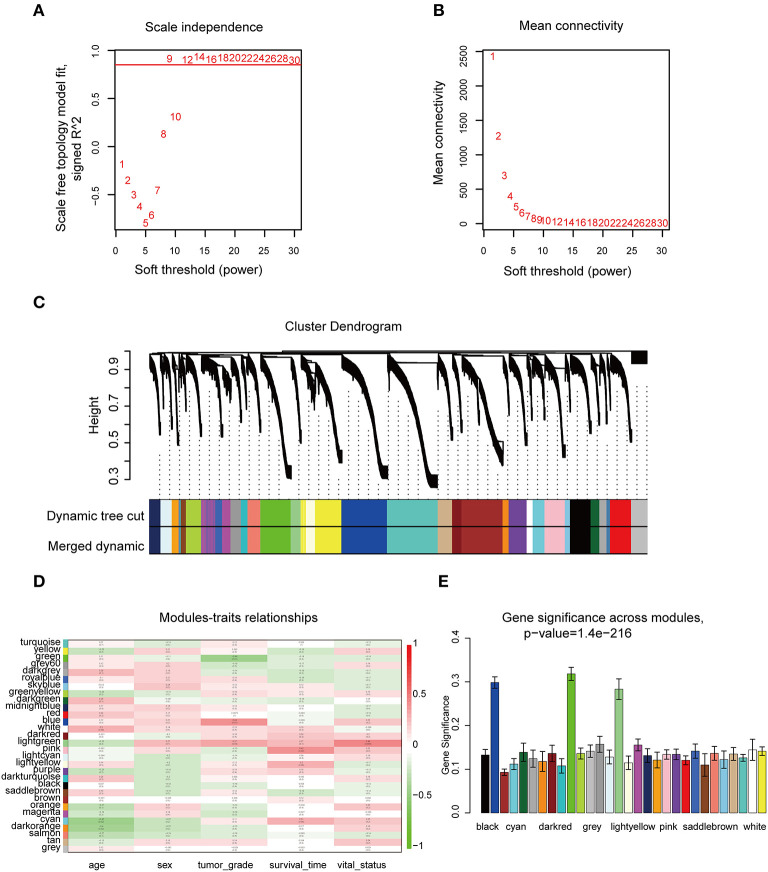
Figure 2.
WGCNA of DEGs in CCA samples. (A) Examination of the scale-free fit index for distinct soft-thresholding powers (β). (B) Examination of the mean connectivity for distinct soft-thresholding powers. (C) Clustering dendrogram of filtered DEGs due to a dissimilarity measure. (D) Heatmap showing the connection between module eigengenes and five clinical traits of CCA. (E) Distribution of mean gene significance and errors in the modules correlated with tumor grade of CCA. WGCNA, weighted gene co-expression network analysis.

