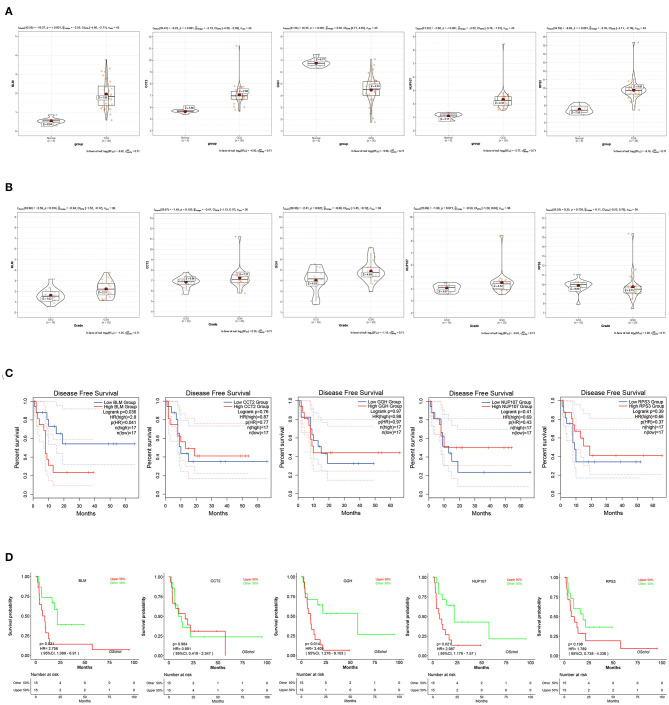
Figure 5.
Validation of candidate hub genes in the TCGA-CHOL data set. (A) bloom syndrome helicase (BLM), CCT2, GGH, NUP107, and RPS3 gene expression contrast between CCA and non-tumorous adjacent samples. (B) Expression of BLM, CCT2, GGH, NUP107, and RPS3 in CCA samples with different pathological grades. (C) Association between BLM, CCT2, GGH, NUP107, and RPS3 expression and disease-free survival time in the TCGA-CHOL data set. The red line indicates samples with high gene expression (above the median value), and the blue line designates the samples with lowly expressed genes (below the median value). (D) Association between BLM, CCT2, GGH, NUP107, and RPS3 expression and disease-free survival time in the data set GSE107943. The red line indicates samples with high gene expression (above the median value), and the green line designates the samples with lowly expressed genes (below the median value).

