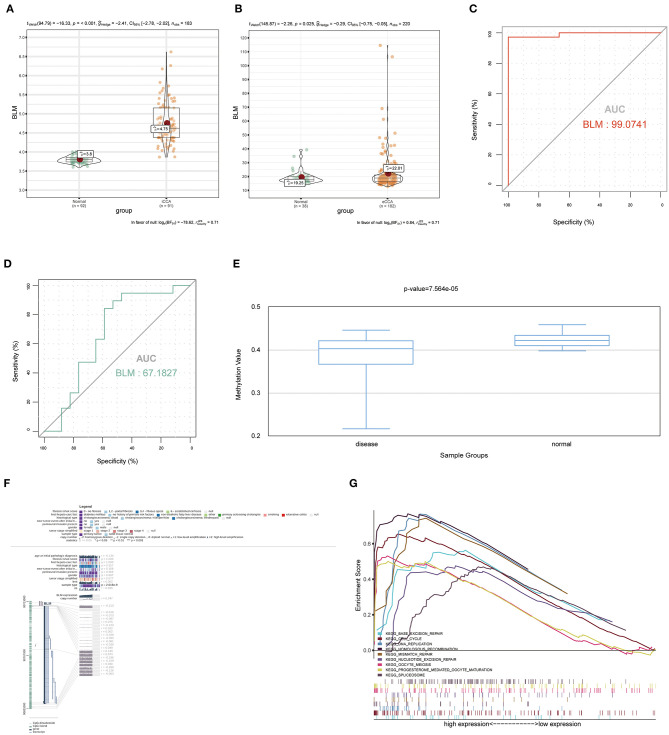
Figure 6.
The expression of BLM in the external data sets of GSE76297 and GSE132305, the methylation level of BLM, the value of BLM in the diagnosis and prediction of recurrence, and gene set enrichment analysis (GSEA). (A) BLM gene expression differences between iCCA and adjacent non-tumor tissues of the iCCA data set GSE76297. (B) BLM gene expression differences between eCCA and adjacent non-tumor tissues of the eCCA data set GSE132305. ROC curves and AUC statistics were used to assess the capacity of BLM for CCA diagnosis (C) and to distinguish recurrent and non-recurrent CCA (D). (E) The methylation levels of BLM in CCA and paracarcinoma tissue were examined by using DiseaseMeth 2.0. (F) The methylation sites of BLM and its associations with gene expression were visualized by using MEXPRESS. (G) GSEA using the TCGA-CHOL data set and statistically 9 significant functional gene sets enriched in CCA samples with high BLM expression were listed. iCCA, intrahepatic cholangiocarcinoma; eCCA, extrahepatic cholangiocarcinoma; ROC, receiver operating characteristic; AUC, area under the curve.

