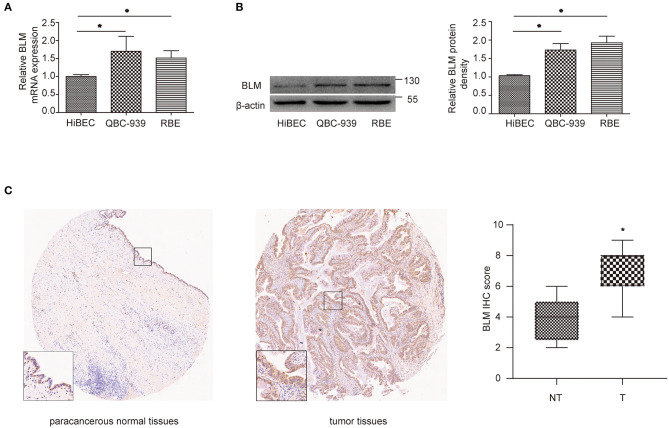
Figure 7.
BLM expression was increased in CCA. (A,B) qRT-PCR (A) and western blot (B) analysis of BLM expression in human biliary epithelial cell lines (HiBECs), QBC-939 cells, and RBE cells. (C) Representative BLM immunohistochemistry (IHC) staining and score for NT and T samples. T, tumoral tissue; NT, corresponding adjacent non-tumoral tissues. Data are represented as the mean ± SEM of 3 independent experiments. *p < 0.05 vs. the control group.

