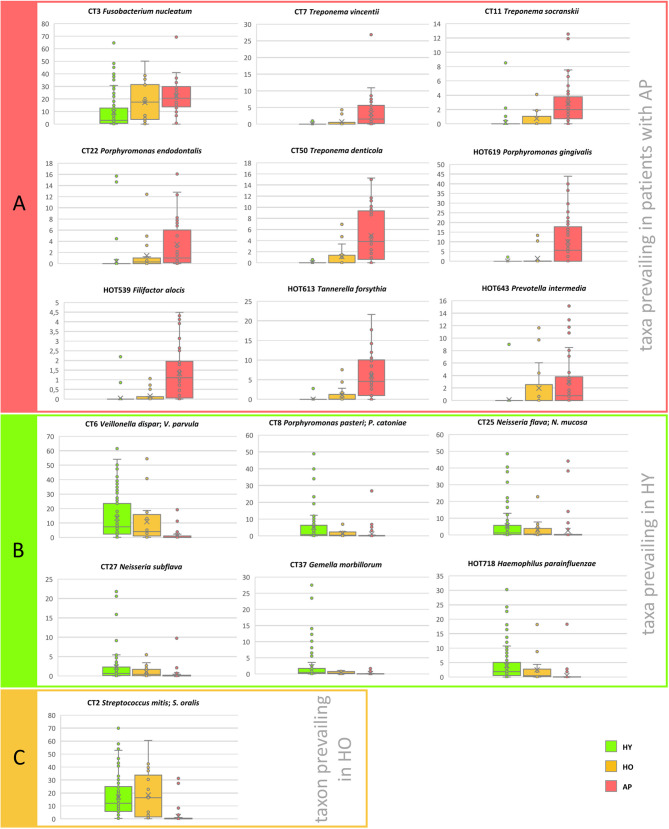
Figure 2.
The distribution of the relative abundances of selected taxa in relation to the age of probands and their state of health. (A) Taxa prevailing in periodontitis, (B) Taxa prevailing in HY, (C) Taxon prevailing in HO. The area of box plots with oral taxa dominant in patients with AP is highlighted in red, HY in green and one boxplot related to taxon most abundant in the HO group is highlighted in yellow. CT stands for combined taxon (See Supplementary Table 3 ).

