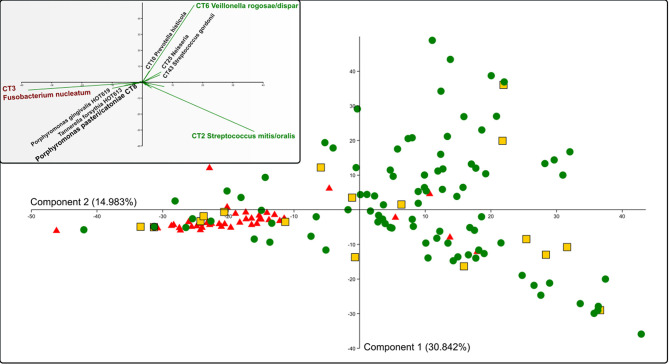
Figure 3.
PCA analysis of all OM samples. Red triangles represent AP samples, green spots HY, and yellow squares represent the HO samples. The inner panel shows the contribution of selected oral taxa to the distribution. The determining taxa for each quadrant are highlighted in colors (green for periodontal health and red for periodontitis), CT8 P. pasteri/catoniae determining the transient state is highlighted by a bigger font. CT stands for combined taxon (See Supplementary Table 3 ).

