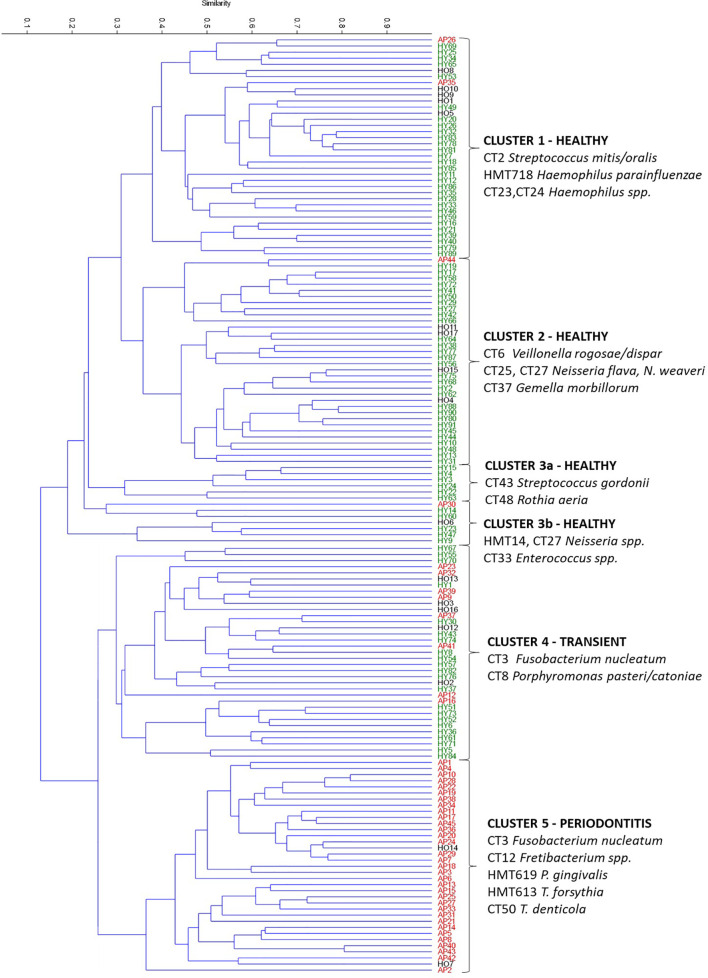
Figure 4.
Hierarchical clustering of all OM samples based on the Bray-Curtis similarity indexes. AP samples are marked red, HO black, and HY green. The upper measure indicates the Bray-curtis value. The determining taxa for each cluster are listed. CT stands for combined taxon (See Supplementary Table 3 ).

