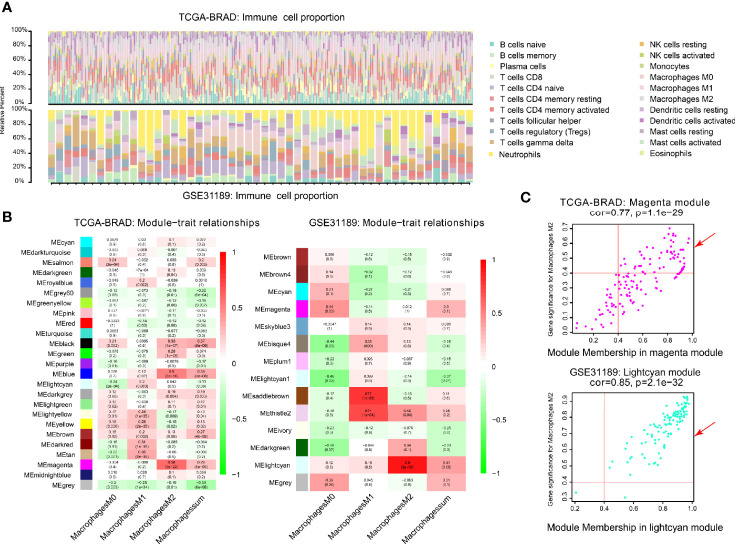
Figure 2.
Co-expression network generated using WGCNA. (A) Immune proportion of TCGA-BLCA; Immune proportion of GEO-GSE31189. (B) Heatmap of module and immune cell proportions of TCGA and GSE31189. (C) The correlations between TCGA magenta module membership and M2 macrophage-related gene significance; The correlation between GSE31189 lightcyan module membership and M2 macrophage-related gene significance.

