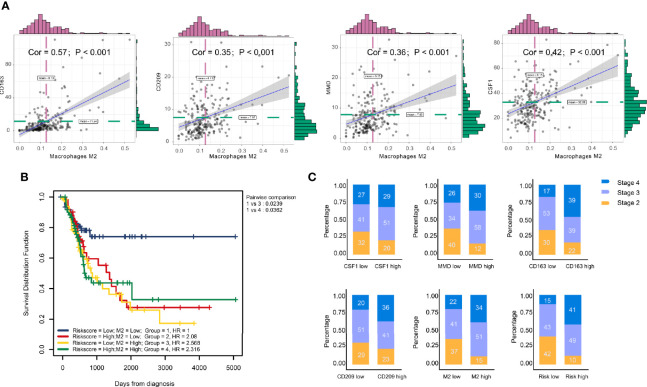
Figure 5.
Clinical phenotype correlation. (A) Significant association between M2 macrophage frequency and co-expression genes are indicated. The correlation of CD163 was the highest at 0.57. (B) Combining infiltrating M2 macrophages elevated the predictive accuracy of risk score even more than either of them alone. The hazard of high ‘M2 + Risk score’ group showed more survival risk than the lower group (Kaplan–Meier analysis, M2 + risk score binary: HR = 2.316). (C) Clinical stage correlation to different expression level of CD163, CD209, CSF1, and MMD.

