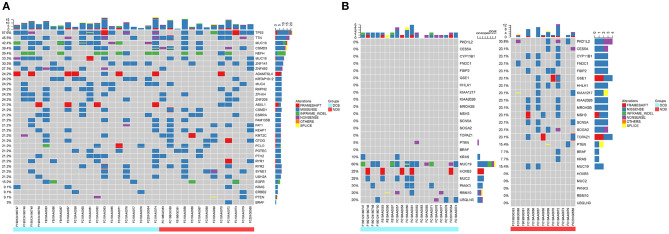
Figure 3.
Summary of molecular features associated with anti-PD-1 inhibitor responses. (A) The top mutation genes revealed by WES are listed. Sample IDs are shown at the bottom. Mutation frequencies are displayed on the left, and gene abbreviations are listed on the right. Icons representing mutation types are listed in different colors (red = frameshift, blue = missense, green = inframe-indel, purple = nonsense, yellow = splice, and orange = others). The top three mutation genes are TP53, TTN, and MUC19 [71.4% (10/14) missense, 21.4% (3/14) inframe-indel, 14.2% (2/14) nonsense, and 7.14% (1/14) splice]. (B) Different high-frequency mutations in patients with DCB (left, blue) and NDB patients (right, red).

