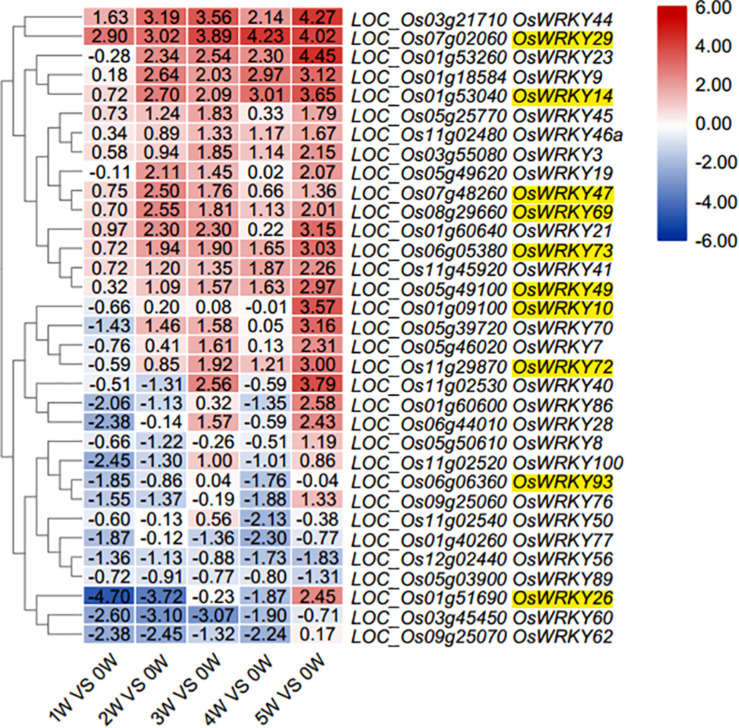
FIGURE 1.
Heat map diagram of relative gene expression levels of 33 OsWKRYs from total 102 WRKYs (Supplementary Dataset S1) in rice flag leaves at six stages during aging. Developmental stages comprising six stages of flag leaf (0, 1, 2, 3, 4, and 5 weeks after heading). Expression values were scaled by Log2Fold change ≥ 1 and FDR < 0.05 normalized to 0W stage of flag leaf development. 10 OsWRKY candidates are indicated with yellow highlight.

