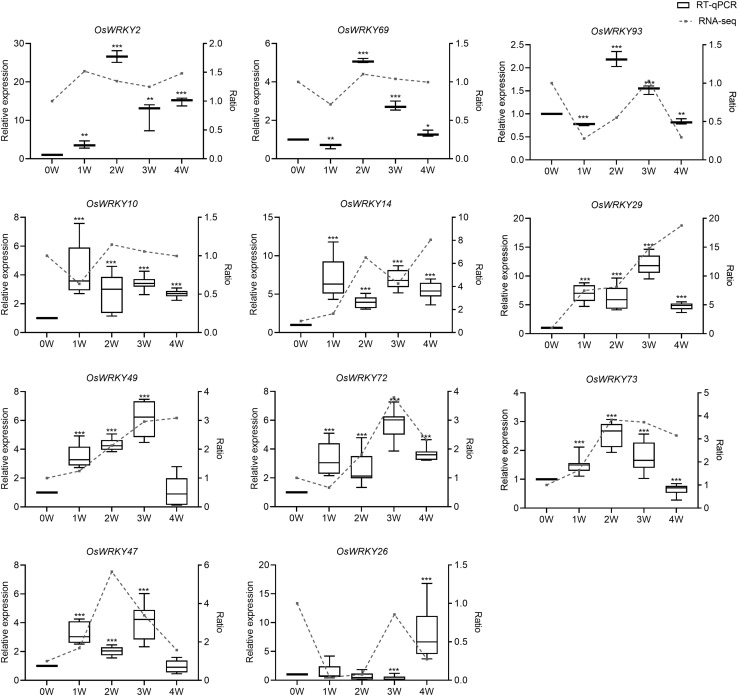
FIGURE 2.
Analyses of several OsWRKYs expression level in rice flag leaves during natural senescence. The expression level was assessed by RT-qPCR. All values were normalized to OsACTIN expression. Box-and-whisker plots show the median value (horizontal lines), interquartile range (boxes), and minimum and maximum values (whiskers). Three biological replicates and three technique replicates were used. The broken-line graphs indicate expression profiles of 11 OsWRKYs from RNA-seq dataset. Asterisks indicate significant differences relative to the 0W controls calculated using the Student t-test: *P < 0.05; **P < 0.01; and ***P < 0.001. The leaf Y_axis denotes relative expression by RT-qPCR. The right y-axis denotes ratio of the fold change of RPKM compared with 0W by RNA-seq. 0W means 0 week after heading.

