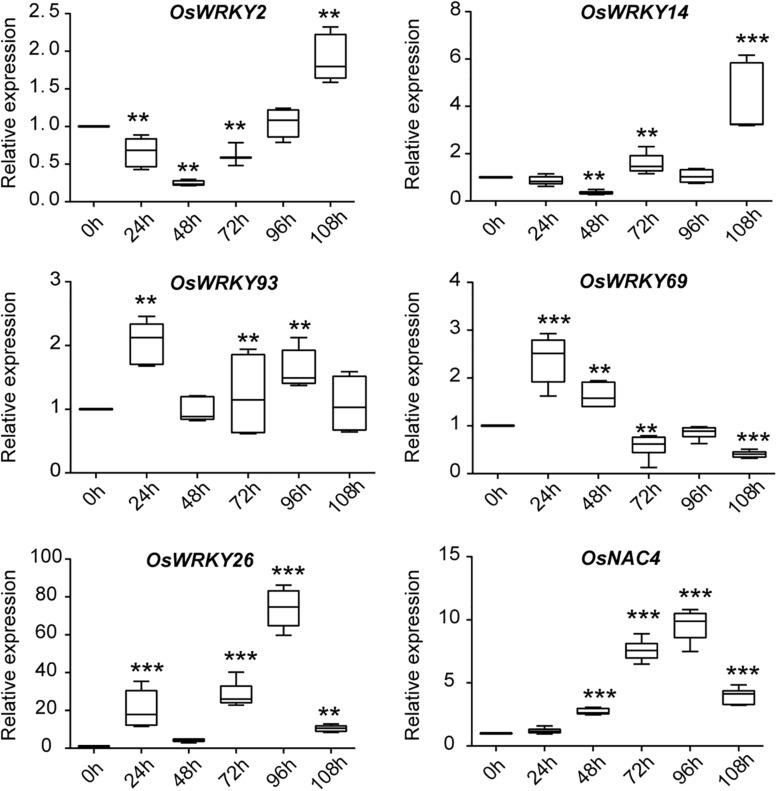
FIGURE 3.
Expression analysis of five OsWRKY genes and the defense-related marker gene OsNAC4 in response to M. oryzae infection. qRT-PCR analysis of five OsWRKYs and OsNAC4 in WT at 0, 24, 48, 72, 96, and 108 h after pathogen treatment. The Y-axis represents the relative expression level normalized to OsACTIN. Box-and-whisker plots show median value (line within box), interquartile range (boxes), and minimum and maximum values (whiskers). Three biological replicates and three technique replicates were used. Asterisk indicate significant differences (**P < 0.01, and ***P < 0.001) based on Student t-test compared to 0 h.

