FIGURE 4.
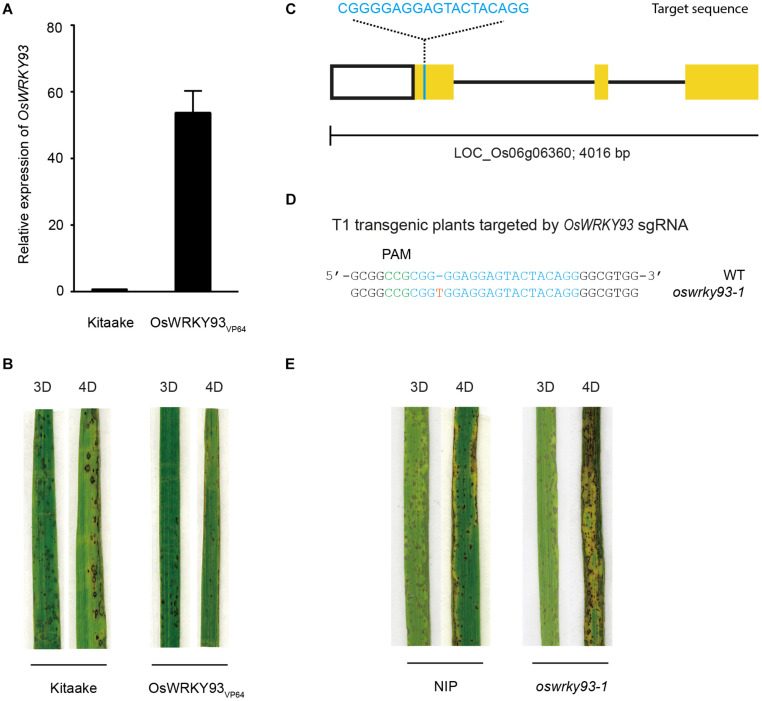
Generation and analysis of the OsWRKY93 transgenic lines. (A) Real-time quantitative PCR experiments showing expression changes of OsWRKY93 in Kitaake and the OsWRKY93VP64. (B) Representative leaves of Kitaake and the OsWRKY93VP64 3 and 4 days after inoculation with M. oryzae. Pathogen infection assays were performed on three biological replicates. (C) Schematic diagram for the CRISPR-edited mutant of OsWRKY93. Yellow boxes and black lines represent exons and introns, respectively. The sgRNA target is cyan. (D) Sequence of the oswrky93-1 mutant identified from transgenic plants of the OsWRKY93 sgRNA target. The reverse complementary sequence of the PAM sequence (5’-CGG-3’) of the sgRNA target is green. The red T represents a one-base insertion. (E) Representative leaves of Nipponbare and oswrky93-1 3 and 4 days after inoculation with M. oryzae. Pathogen infection assays were performed on three biological replicates.

