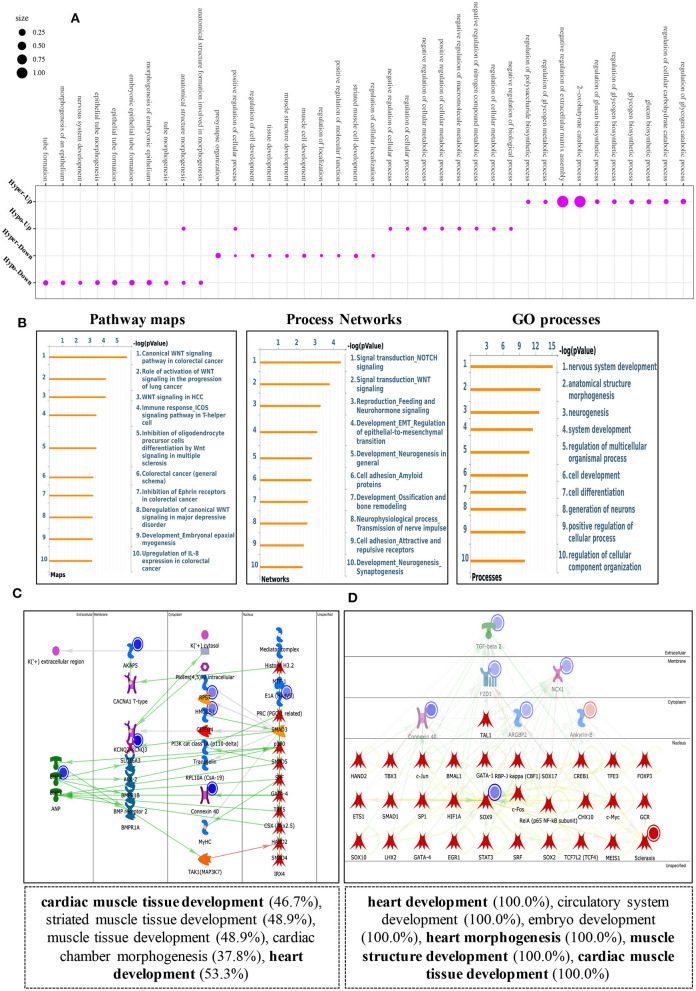
Figure 6.
Key pathway analysis of differentially m6A-modifed genes in MeRIP-seq and RNA-seq data. (A) Bubble diagram of GO biological process categories enriched for DEGs with m6A hyper- or hypo-methylated. (B) Pathway maps analysis (left), Process networks analysis (middle), GO process analysis (right) of differentially m6A-modifed genes. (C) Top scored networks analysis of m6A-modified genes. (D) Key transcription factors and target genes network analysis of m6A-modifed genes.

