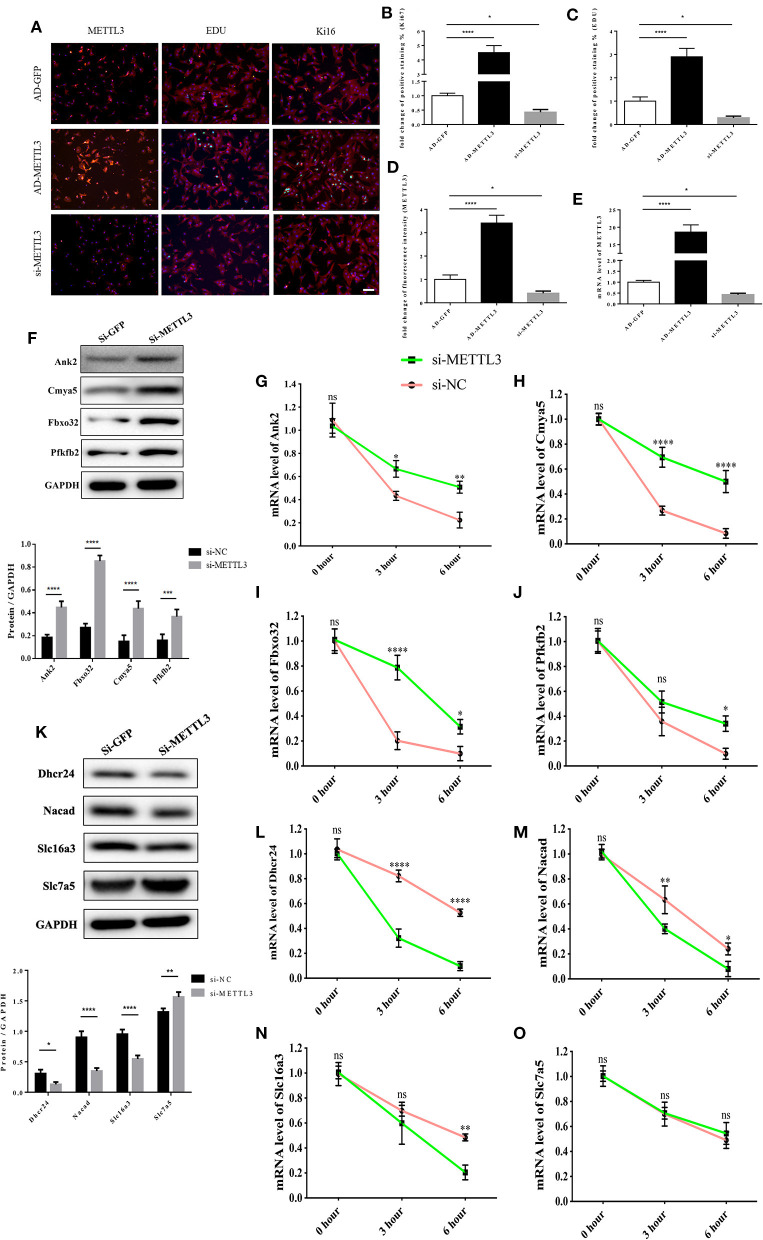
Figure 8.
The functional link of enhanced METTL3 expression to transcript stability of target genes. (A–D) Representative immunofluorescence images of NRCMs from P0 rat hearts labeled with METTL3, EDU, and Ki67 (METTL3, or α-actinin, red; EDU, or Ki67, green; DAPI, blue. Scale bars, 50 μm) (A) and their corresponding quantitative analysis (B–D). (E) mRNA expression level of METTL3 of NRCMs from P0 rat hearts transfected with AD-GFP, AD-METTL3, or si-METTL3 determined by the qPCR method. (F) Protein expression levels of Pfkfb2, Ank2, Cmya5, and Fbxo32 in P0 NRCMs transfected with si-NC or si-METTL3 (up) and the corresponding densitometric analysis (down). (G–J) mRNA expression level of Ank2 (G), Cmya5 (H), Fbxo32 (I), and Pfkfb2 (J) in P0 NRCMs transfected with si-NC or si-METTL3 after treated with 20μg/ml Actinomycin D for 0, 3 or 6 hours. (K) Protein expression levels of Dhcr24, Nacad, Slc16a3, and Slc7a5 in P0 NRCMs transfected with si-NC or si-METTL3 (up) and the corresponding densitometric analysis (down). (L–O) mRNA expression level of Dhcr24 (L), Nacad (M), Slc16a3 (N), and Slc7a5 (O) in P0 NRCMs transfected with si-NC or si-METTL3 after treated with 20 μg/ml Actinomycin D for 0, 3 or 6 h. GAPDH was detected as the loading control. *P < 0.05, **P < 0.01, ****P < 0.001, *****P < 0.0001, compared to the si-NC group.

