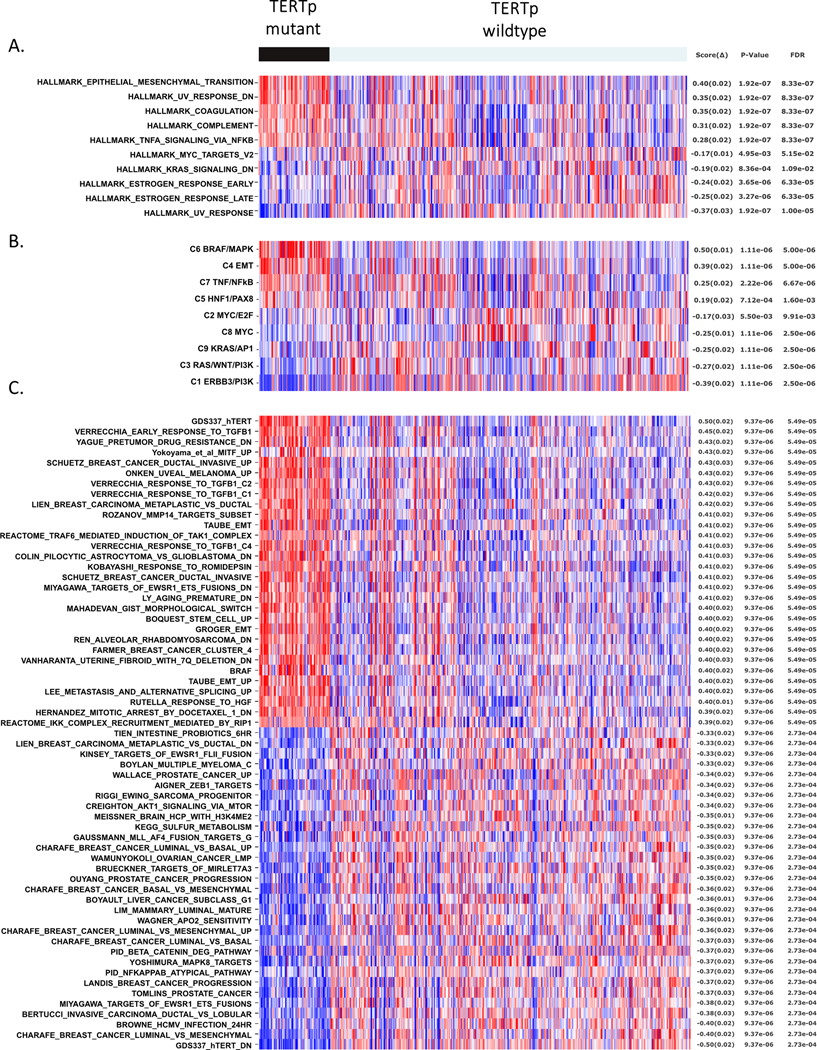
Figure 1. TERTp mutants from divergent tissues share specific expression profiles.

(A) Matching the single-sample GSEA (ssGSEA) profiles of MSigDB Hallmark gene sets stratified by TERTp status in the CCLE cancer cell lines. The figure shows the five most correlated and anticorrelated gene sets. The top hit is the hallmark that represents the epithelial-mesenchymal transition (EMT). (B) Matching the ssGSEA profiles of gene sets representing major oncogenic pathway components (9 gene sets) against the TERTp status on the CCLE cancer cell lines. The top two hits are the component C6 that represents BRAF/MAPK activation, and C4 that represents EMT. (C) Matching the ssGSEA profiles of a general collection of gene sets from the C2 subset of MSigDB, plus additional gene sets from the literature (5,334 gene sets), against the TERTp status on the CCLE cancer cell lines. The top hits include gene sets representing EMT, BRAF and MITF activation signatures, response to TGFβ1, invasion, stemness, metastasis and TERT overexpression. All the featured gene sets in Figs 1A–C displayed significance p ≤ 0.001.
