
Figure 1.
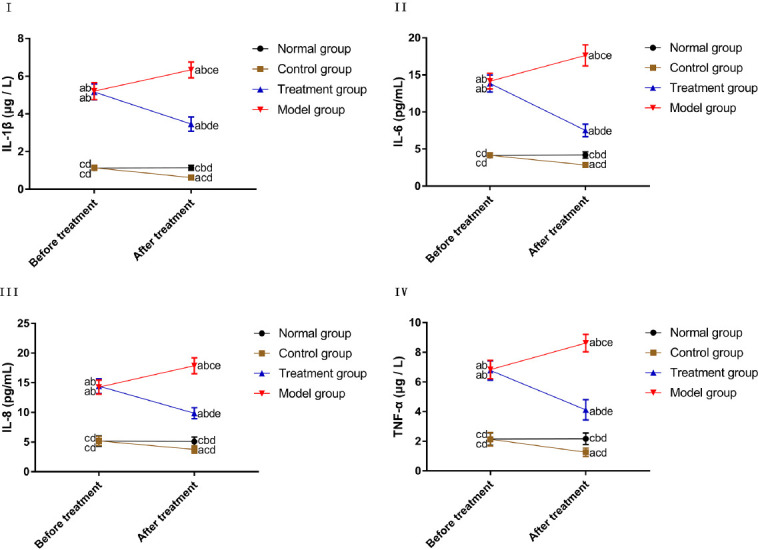
Comparison of inflammatory factors. I. Comparison of the IL-1 β level. II. Comparison of the IL-6 level. III. Comparison of the IL-8 level. IV. Comparison of the TNF- α level. “a” represents aP<0.05 when compared with NG at the same time point. “b” represents bP<0.05 when compared with CG at the same time point. “c” represents cP<0.05 when compared with TG at the same time point. “d” represents dP<0.05 when compared with MG at the same time point. “e” represents eP<0.05 when compared with data before treatment within the group.