Figure 4.

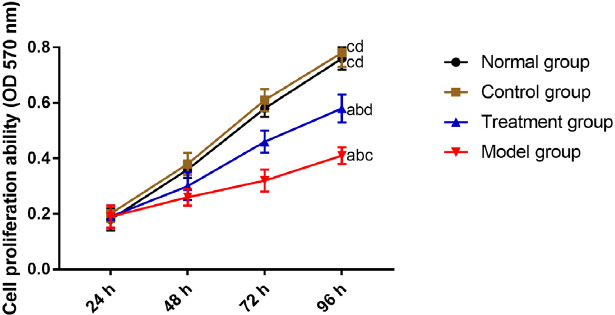
Comparison of the chondrocyte activity. “a” represents aP<0.05 when compared with NG. “b” represents bP<0.05 when compared with CG. “c” represents cP<0.05 when compared with TG. “d” represents dP<0.05 when compared with MG.

Comparison of the chondrocyte activity. “a” represents aP<0.05 when compared with NG. “b” represents bP<0.05 when compared with CG. “c” represents cP<0.05 when compared with TG. “d” represents dP<0.05 when compared with MG.