
FIGURE 2.
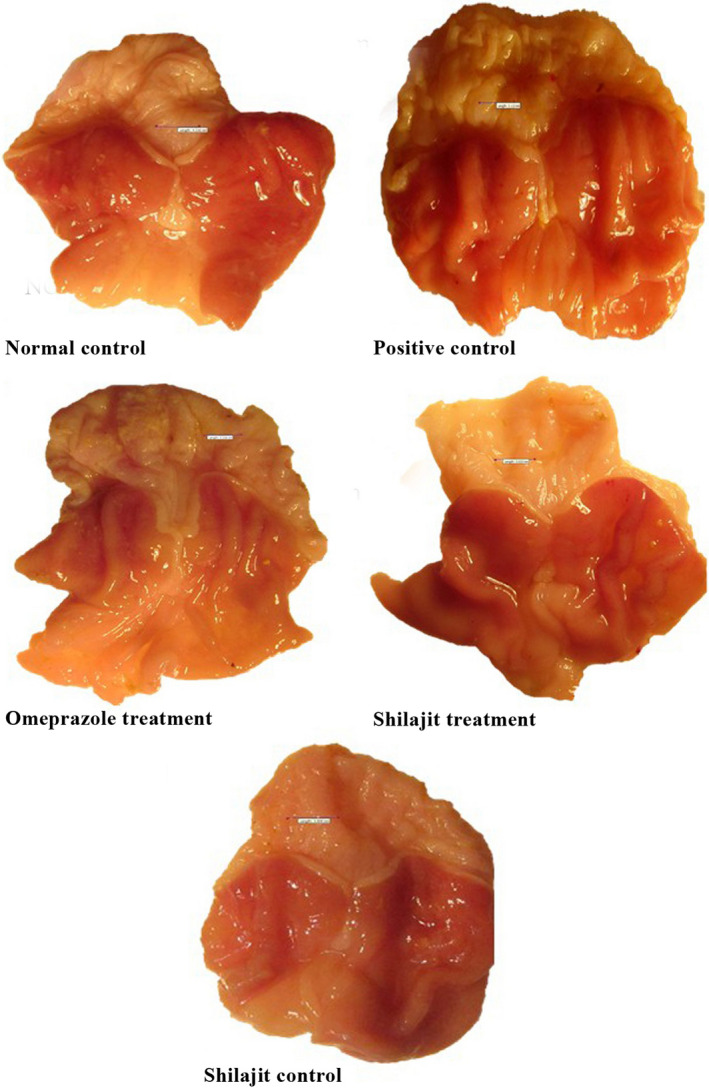
Macroscopic appearance of the stomach in different groups. Normal control group: scale bar = 4.21 mm; Positive control group: scale bar = 3.11 mm; Animals treated with omeprazole: scale bar = 3.31 mm; Animals treated with the aqueous extract of Shilajit: scale bar = 3.02 mm; Shilajit control group: scale bar = 3.60 mm