
FIGURE 5.
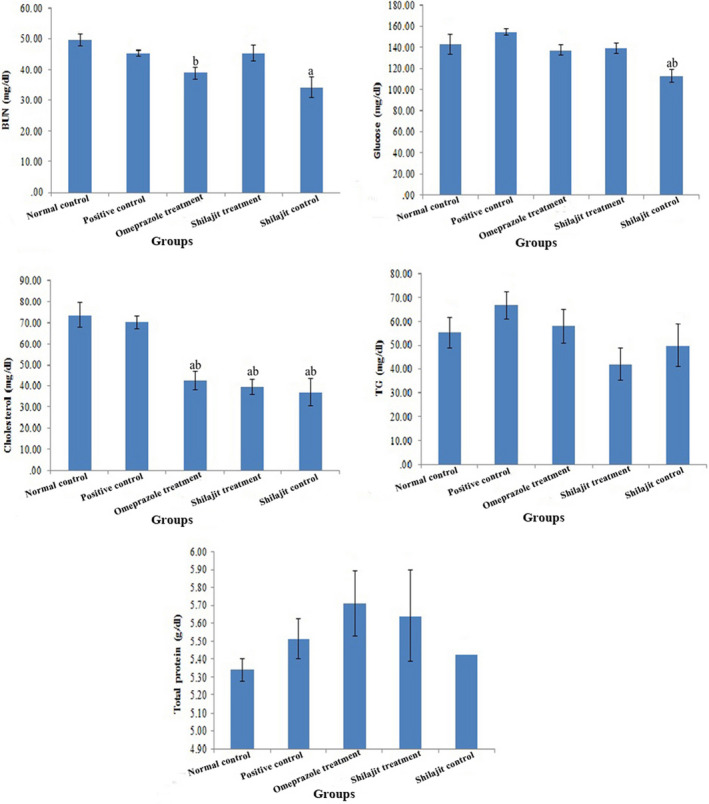
BUN, Glucose, Cholesterol, TG, and Total protein levels in different groups (normal control, positive control, omeprazole treatment, Shilajit treatment, Shilajit control), respectively (mean±SEM). a: Significantly different from positive group at p < 0.05. b: Significantly different from normal group at p < 0.05