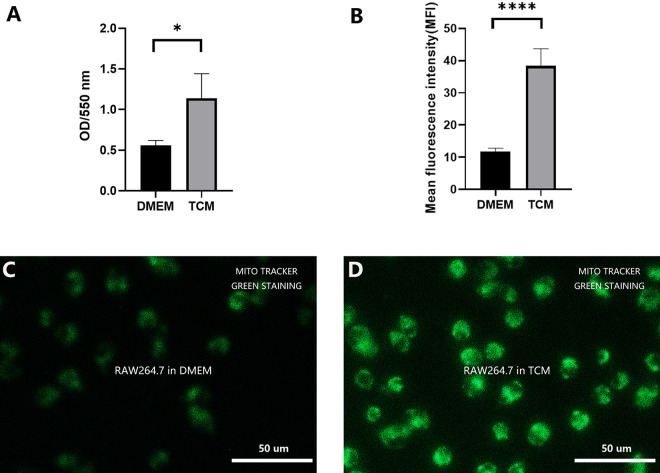
Figure 3.
The phagocytic potential and energy metabolism status of the mitochondria. (A) After 48 h, phagocytosis was significantly enhanced in TCM-treated RAW264.7 cells compared to that in DMEM-treated cells. (*P < 0.05, Student’s t test. Error bars: SD). (B) Semi-quantitative analysis revealed significantly higher mean fluorescence intensity in the mitochondria in the TCM group compared to that in the DMEM group (**** P < 0.0001, Student’s t test. Error bars: SD). (C) Fluorescence microscopic observation of MitoTracker Green staining of DMEM-treated RAW264.7 cells. (D) Fluorescence microscopic observation of MitoTracker Green staining of TCM-treated RAW264.7 cells.

