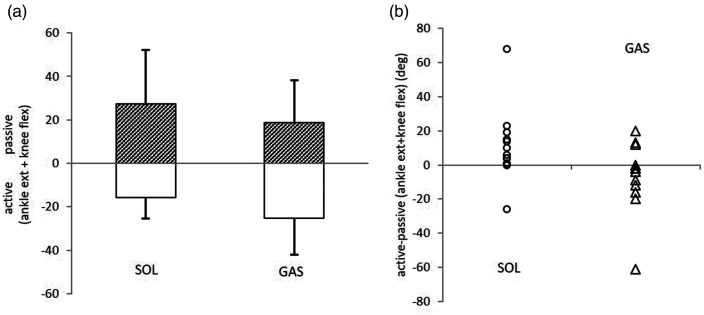
Figure 4.
a: Comparison of the active ankle extension plus knee flexion (upward direction; hatched bars) and the passive ankle extension plus knee flexion (downward direction; open bars) in the soleus (SOL) and gastrocnemius (GAS) groups. b: The difference between active ankle extension plus knee flexion minus the passive ankle extension plus knee flexion was significantly larger in the SOL group (open circles) than in the GAS group (open triangles).

