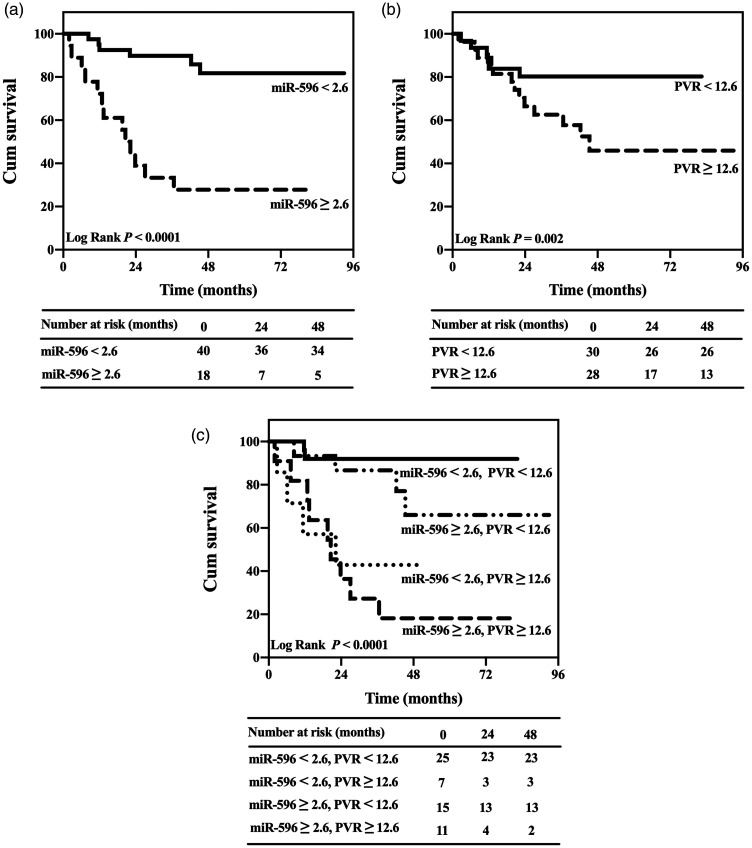
Figure 3.
Kaplan–Meier survival curve analyses in patients with idiopathic pulmonary arterial hypertension in the study (n = 12) and validation groups (n = 46). (a) Analysis based on microRNA (miR)-596 levels (cut-off 2.6). (b) Analysis based on pulmonary vascular resistance (PVR) levels (cut-off 12.6 Wood units). (c) Combined analysis with both miR-596 and PVR levels.

