
Extended Data Fig. 6 |. Hepatic gene expression profiles of intestine-specific Khk-C KO mice after chronic sucrose drinking.
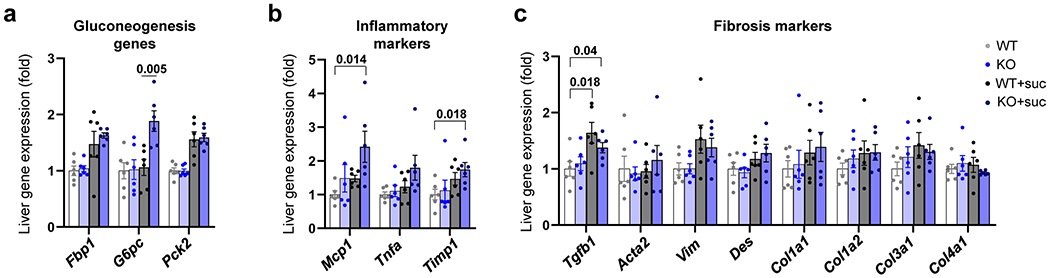
a–c, Mice received normal water or 10% sucrose water for 5 months. Then, the livers were isolated at 9 AM and the mRNA levels of the indicated genes were measured (N = 6, 6, 11, 15 mice). Data are mean ± standard error. Numbers in graphs indicate P-values by two-sided Student’s t-test.