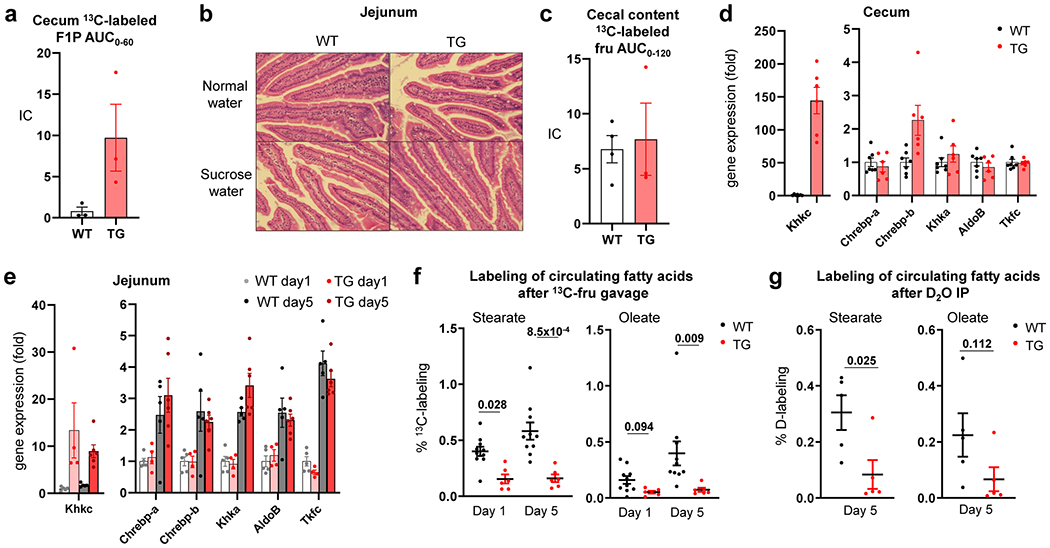
Extended Data Fig. 9 |. Intestine-specific Khk-C TG overexpression induces cecal fructose catabolism and reduces lipogenesis.

a–d, Mice received normal water or sucrose water for 3 months. Mice received 1:1 mixture of 13C-fructose and unlabeled glucose (1 g/kg) via oral gavage and the AUC of cecal labeled F1P was measured in a (N = 3 mice per group). Representative hematoxylin & eosin stained jejunum sections from two independent experiments are shown in b. Mice received 1:1 mixture of 13C-fructose and unlabeled glucose (1 g/kg) via oral gavage and the AUC of labeled fructose in the cecal content was measured in c (N = 4, 3 mice). The mRNA levels of fructolytic genes in the cecum was measured in d (N = 7, 6 mice). e-g, Mice received 1:1 mixture of fructose and glucose (2 g/kg each) via oral gavage twice a day for five days. The mRNA levels of fructolytic genes in the jejunum was measured in e (N = 5, 4, 5, 6 mice). On the first day (day 1) or the last day (day 5), the mice received 1:1 mixture of 13C-fructose and unlabeled glucose (2 g/kg each) via oral gavage and the 13C-labeling of the indicated circulating saponified fatty acids was measured after 6 h in f (N = 10 mice for WT, 6 mice for TG). Alternatively, on day 5, mice received 100% D2O via intra-peritoneal injection and the deuterium labeling of the indicated circulating saponified fatty acids was measured after 6 h in g (N = 5 mice per group). Data are mean ± standard error. Numbers in graphs indicate P-values by two-sided Student’s t-test.
